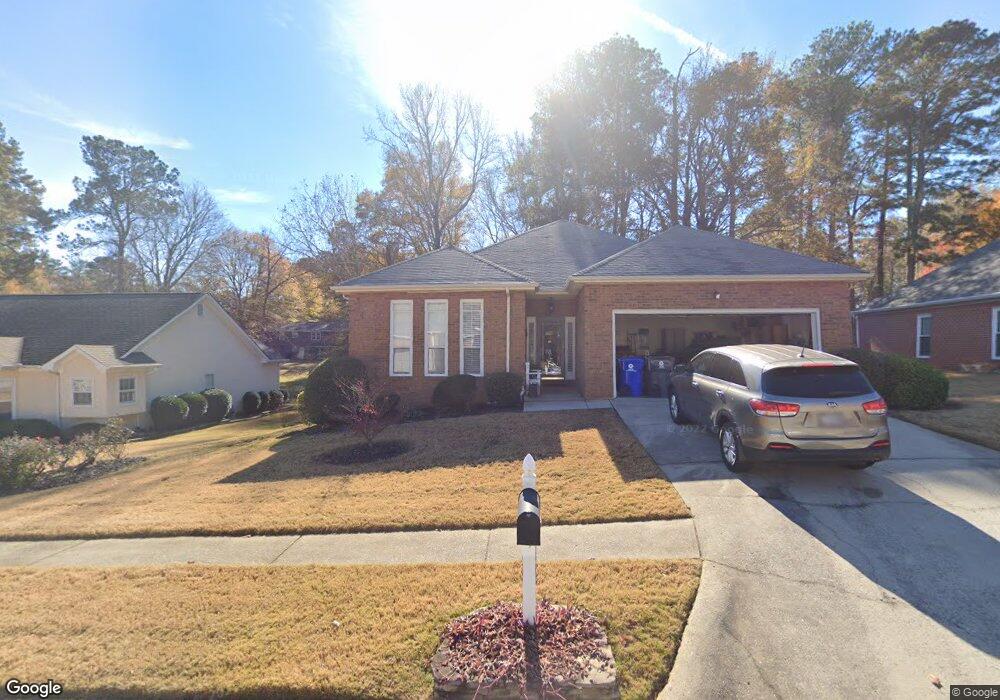
135 Fenwyck Commons Fayetteville, GA 30214
Estimated Value: $348,000 - $392,000
3
Beds
2
Baths
1,977
Sq Ft
$185/Sq Ft
Est. Value
About This Home
This home is located at 135 Fenwyck Commons, Fayetteville, GA 30214 and is currently estimated at $365,321, approximately $184 per square foot. 135 Fenwyck Commons is a home located in Fayette County with nearby schools including Bennett's Mill Middle School, Fayette County High School, and Rising Star Montessori School.
Ownership History
Date
Name
Owned For
Owner Type
Purchase Details
Closed on
Aug 15, 2017
Sold by
Sawyer Michael D
Bought by
Sawyer Michael D and Sawyer Shara A
Current Estimated Value
Home Financials for this Owner
Home Financials are based on the most recent Mortgage that was taken out on this home.
Original Mortgage
$189,000
Outstanding Balance
$157,706
Interest Rate
3.96%
Mortgage Type
New Conventional
Estimated Equity
$207,615
Purchase Details
Closed on
Nov 20, 2008
Sold by
Brewer Elizabeth V
Bought by
Espinosa Luis and Reyes Daylet
Home Financials for this Owner
Home Financials are based on the most recent Mortgage that was taken out on this home.
Original Mortgage
$182,132
Interest Rate
6.51%
Mortgage Type
FHA
Create a Home Valuation Report for This Property
The Home Valuation Report is an in-depth analysis detailing your home's value as well as a comparison with similar homes in the area
Home Values in the Area
Average Home Value in this Area
Purchase History
| Date | Buyer | Sale Price | Title Company |
|---|---|---|---|
| Sawyer Michael D | -- | -- | |
| Sawyer Michael D | $210,000 | -- | |
| Espinosa Luis | $190,000 | -- |
Source: Public Records
Mortgage History
| Date | Status | Borrower | Loan Amount |
|---|---|---|---|
| Open | Sawyer Michael D | $189,000 | |
| Previous Owner | Espinosa Luis | $182,132 |
Source: Public Records
Tax History Compared to Growth
Tax History
| Year | Tax Paid | Tax Assessment Tax Assessment Total Assessment is a certain percentage of the fair market value that is determined by local assessors to be the total taxable value of land and additions on the property. | Land | Improvement |
|---|---|---|---|---|
| 2024 | $1,829 | $144,624 | $25,600 | $119,024 |
| 2023 | $1,339 | $138,880 | $25,600 | $113,280 |
| 2022 | $1,796 | $126,560 | $18,000 | $108,560 |
| 2021 | $1,723 | $94,680 | $18,000 | $76,680 |
| 2020 | $1,871 | $91,360 | $14,400 | $76,960 |
| 2019 | $2,802 | $89,720 | $14,400 | $75,320 |
| 2018 | $2,651 | $84,000 | $14,360 | $69,640 |
| 2017 | $2,325 | $79,920 | $14,400 | $65,520 |
| 2016 | $2,039 | $68,920 | $14,400 | $54,520 |
| 2015 | $1,924 | $64,080 | $14,400 | $49,680 |
| 2014 | $1,775 | $58,280 | $14,400 | $43,880 |
| 2013 | -- | $58,000 | $0 | $0 |
Source: Public Records
Map
Nearby Homes
- 500 Circle Dr
- 482 N Jeff Davis Dr Unit 5
- 12 Intown Place
- 498 N Jeff Davis Dr
- 42 Intown Place
- 37 Intown Place
- 135 Rabbits Run
- 125 Rabbits Run
- 105 Rabbits Run
- 210 Rosewood Dr
- 250 Jeff Davis Place
- 250 Mimosa Dr
- GA 85 S GA Highway 85
- 140 Reese St
- 130 Reese St
- 150 Reese St
- 180 Habersham Place
- 315 Enchanted Ct
- 225 Buckeye Ln Unit 2
- 310 Autumn Glen Cir
- 135 Fenwyck Commons
- 125 Fenwyck Commons
- 125 Fenwyck Commons
- 145 Fenwyck Commons
- 145 Fenwyck Commons
- 115 Fenwyck Commons
- 115 Fenwyck Commons
- 155 Fenwyck Commons
- 255 Pine Cir
- 140 Fenwyck Commons
- 150 Fenwyck Commons
- 285 Pine Cir
- 130 Fenwyck Commons
- 160 Fenwyck Commons
- 160 Fenwyck Commons
- 105 Fenwyck Commons Unit 35
- 105 Fenwyck Commons
- 105 Fenwyck Commons
- 165 Fenwyck Commons
- 120 Fenwyck Commons