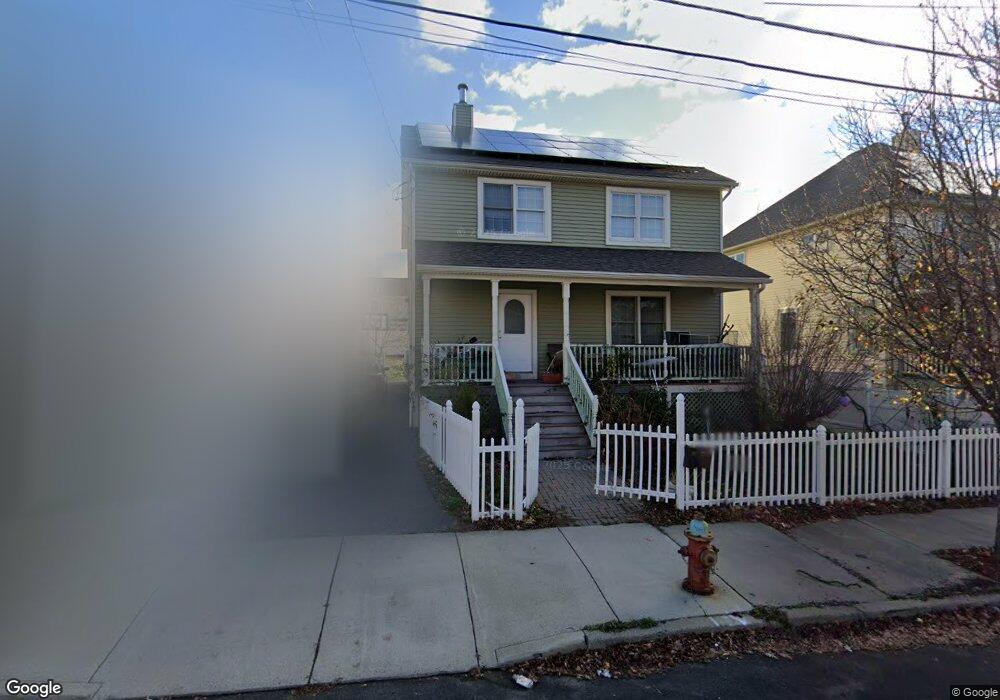
135 Flint St Lynn, MA 01905
Lower Boston Street NeighborhoodEstimated Value: $592,000 - $713,000
3
Beds
2
Baths
1,500
Sq Ft
$447/Sq Ft
Est. Value
About This Home
This home is located at 135 Flint St, Lynn, MA 01905 and is currently estimated at $670,053, approximately $446 per square foot. 135 Flint St is a home located in Essex County with nearby schools including North Park Elementary School, William R. Fallon School, and Lincoln-Thomson Elementary School.
Ownership History
Date
Name
Owned For
Owner Type
Purchase Details
Closed on
Jan 31, 2008
Sold by
Lynn Cmnty Dev Hsng Co
Bought by
Dominic Lawrence and Dominic Hilda
Current Estimated Value
Home Financials for this Owner
Home Financials are based on the most recent Mortgage that was taken out on this home.
Original Mortgage
$300,000
Outstanding Balance
$190,416
Interest Rate
6.18%
Mortgage Type
Purchase Money Mortgage
Estimated Equity
$479,637
Create a Home Valuation Report for This Property
The Home Valuation Report is an in-depth analysis detailing your home's value as well as a comparison with similar homes in the area
Home Values in the Area
Average Home Value in this Area
Purchase History
| Date | Buyer | Sale Price | Title Company |
|---|---|---|---|
| Dominic Lawrence | $300,000 | -- | |
| Dominic Lawrence | $300,000 | -- |
Source: Public Records
Mortgage History
| Date | Status | Borrower | Loan Amount |
|---|---|---|---|
| Open | Dominic Lawrence | $300,000 | |
| Closed | Dominic Lawrence | $300,000 |
Source: Public Records
Tax History Compared to Growth
Tax History
| Year | Tax Paid | Tax Assessment Tax Assessment Total Assessment is a certain percentage of the fair market value that is determined by local assessors to be the total taxable value of land and additions on the property. | Land | Improvement |
|---|---|---|---|---|
| 2025 | $6,811 | $657,400 | $226,600 | $430,800 |
| 2024 | $6,327 | $600,900 | $199,100 | $401,800 |
| 2023 | $6,224 | $558,200 | $205,600 | $352,600 |
| 2022 | $5,932 | $477,200 | $152,300 | $324,900 |
| 2021 | $5,526 | $424,100 | $140,000 | $284,100 |
| 2020 | $5,446 | $406,400 | $134,800 | $271,600 |
| 2019 | $5,420 | $379,000 | $126,900 | $252,100 |
| 2018 | $5,439 | $359,000 | $140,000 | $219,000 |
| 2017 | $5,084 | $325,900 | $116,400 | $209,500 |
| 2016 | $4,946 | $305,700 | $108,900 | $196,800 |
| 2015 | $4,794 | $286,200 | $108,100 | $178,100 |
Source: Public Records
Map
Nearby Homes
- 14 Atkinson St
- 93 Robinson St
- 268 Walnut St
- 92-94 Newton Ave
- 28 Wyman St
- 447 Boston St
- 505-507 Boston St
- 10 Carnes St
- 75 Moulton St
- 27 Bradford Terrace
- 40 Grove St
- 110 Holyoke St
- 11 Linwood Rd
- 75 Grove St
- 20 Murray St
- 35 Curran Rd
- 39 Centre St
- 100 Ashland St
- 32 Birch Brook Rd Unit 27
- 32 Birch Brook Rd Unit 16