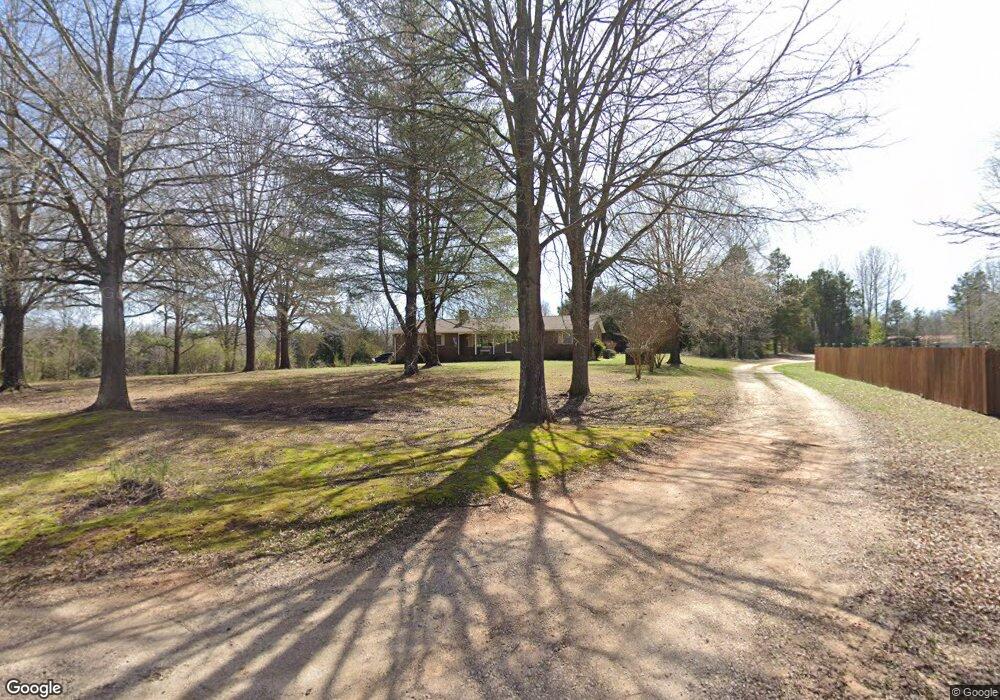
135 Harmony Ln China Grove, NC 28023
Estimated Value: $280,000 - $317,360
3
Beds
2
Baths
1,362
Sq Ft
$213/Sq Ft
Est. Value
About This Home
This home is located at 135 Harmony Ln, China Grove, NC 28023 and is currently estimated at $290,090, approximately $212 per square foot. 135 Harmony Ln is a home located in Rowan County with nearby schools including Landis Elementary School, Corriher Lipe Middle School, and South Rowan High School.
Ownership History
Date
Name
Owned For
Owner Type
Purchase Details
Closed on
Jun 29, 2022
Sold by
Horne James O and Horne Deborah K
Bought by
Horne David and Horne Hanna
Current Estimated Value
Home Financials for this Owner
Home Financials are based on the most recent Mortgage that was taken out on this home.
Original Mortgage
$132,275
Outstanding Balance
$126,017
Interest Rate
5.25%
Mortgage Type
New Conventional
Estimated Equity
$164,073
Purchase Details
Closed on
Jan 29, 2016
Sold by
Severt Robert A
Bought by
Horne James O and Horne Deborah K
Home Financials for this Owner
Home Financials are based on the most recent Mortgage that was taken out on this home.
Original Mortgage
$122,735
Interest Rate
4.37%
Mortgage Type
FHA
Purchase Details
Closed on
Mar 14, 2014
Sold by
Severt Robert A and Severt Paula G
Bought by
Severt Robert A
Create a Home Valuation Report for This Property
The Home Valuation Report is an in-depth analysis detailing your home's value as well as a comparison with similar homes in the area
Home Values in the Area
Average Home Value in this Area
Purchase History
| Date | Buyer | Sale Price | Title Company |
|---|---|---|---|
| Horne David | $275,000 | None Listed On Document | |
| Horne James O | $125,000 | None Available | |
| Severt Robert A | -- | None Available |
Source: Public Records
Mortgage History
| Date | Status | Borrower | Loan Amount |
|---|---|---|---|
| Open | Horne David | $132,275 | |
| Previous Owner | Horne James O | $122,735 |
Source: Public Records
Tax History Compared to Growth
Tax History
| Year | Tax Paid | Tax Assessment Tax Assessment Total Assessment is a certain percentage of the fair market value that is determined by local assessors to be the total taxable value of land and additions on the property. | Land | Improvement |
|---|---|---|---|---|
| 2025 | $1,412 | $208,406 | $52,360 | $156,046 |
| 2024 | $1,412 | $208,406 | $52,360 | $156,046 |
| 2023 | $1,412 | $208,406 | $52,360 | $156,046 |
| 2022 | $1,361 | $180,320 | $43,890 | $136,430 |
| 2021 | $1,325 | $180,320 | $43,890 | $136,430 |
| 2020 | $1,325 | $180,320 | $43,890 | $136,430 |
| 2019 | $1,325 | $180,320 | $43,890 | $136,430 |
| 2018 | $1,165 | $159,874 | $43,890 | $115,984 |
| 2017 | $1,165 | $159,874 | $43,890 | $115,984 |
| 2016 | $1,165 | $159,874 | $43,890 | $115,984 |
| 2015 | $878 | $159,874 | $43,890 | $115,984 |
| 2014 | $822 | $116,157 | $28,209 | $87,948 |
Source: Public Records
Map
Nearby Homes
- 185 Homer Corriher Rd
- 145 Darlington Dr
- 255 Wilson St
- 413 W Ridge Ave
- 813 S Zion St
- 0 W Ridge Ave
- 604 S Zion St
- 959 Tamary Way Unit 29/30
- 2319 Tullymore Dr Unit 39
- 406 W Mill St
- 1725 Saw Rd
- 2274 Tullymore Dr Unit 14
- 514 W Blume St
- 321 N Kimmons St
- 411 S Central Ave
- 233 E Rice St Unit 9
- 208 S Chapel St
- 616 S Main St
- 0 N Chapel St
- 2909 Glendale Ave
- 139 Harmony Ln
- 255 Harmony Ln
- 460 Homer Corriher Rd
- 430 Homer Corriher Rd
- 1050 Shadywoods Rd
- 260 Harmony Ln
- 550 Homer Corriher Rd
- 525 Homer Corriher Rd
- 440 Homer Corriher Rd
- 1110 Shadywoods Rd
- 620 Homer Corriher Rd
- 445 Homer Corriher Rd
- 420 Homer Corriher Rd
- 1085 Shadywoods Rd
- 1085 Shady Woods Rd
- 380 Homer Corriher Rd
- 630 Homer Corriher Rd
- 625 Homer Corriher Rd
- 635 Homer Corriher Rd
- 640 Homer Corriher Rd