135 High Rd Cornish, ME 04020
Estimated Value: $295,237 - $485,000
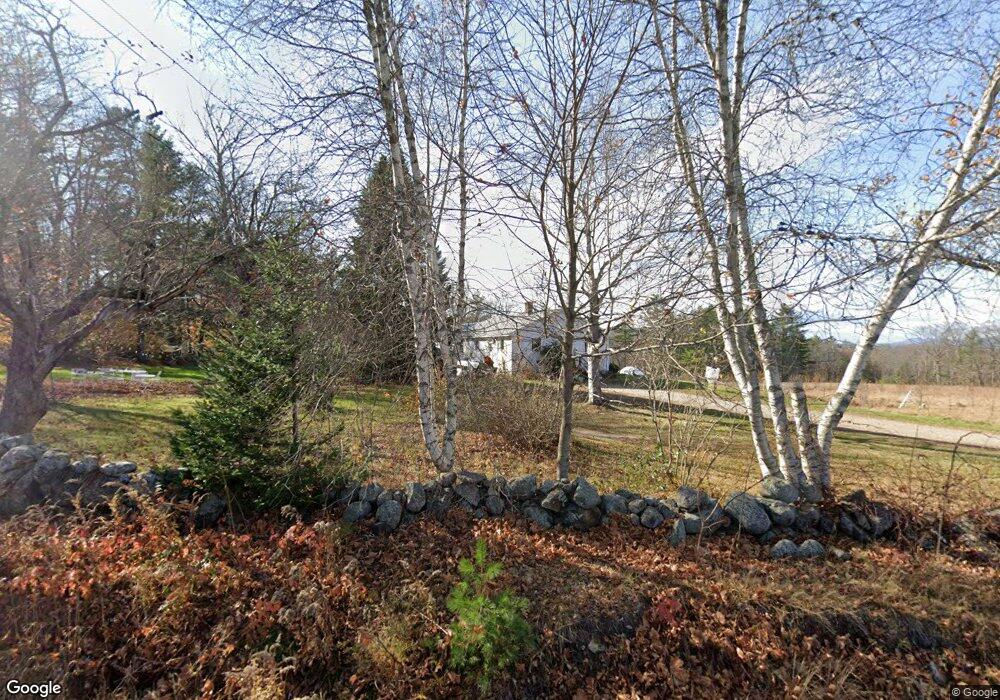
About This Home
This home is located at 135 High Rd, Cornish, ME 04020 and is currently estimated at $369,559, approximately $233 per square foot. 135 High Rd is a home located in York County.
Ownership History
We collect this data history from publicly available records. To have your information removed, we recommend requesting removal directly through your county’s website.
Purchase Details
Home Financials for this Owner
Home Financials are based on the most recent Mortgage that was taken out on this home.Purchase Details
Home Values in the Area
Average Home Value in this Area
Purchase History
We collect this data history from publicly available records. To have your information removed, we recommend requesting removal directly through your county’s website.
| Date | Buyer | Sale Price | Title Company |
|---|---|---|---|
| -- | -- | ||
| -- | -- | ||
| $170,000 | -- | ||
| $170,000 | -- |
Mortgage History
We collect this data history from publicly available records. To have your information removed, we recommend requesting removal directly through your county’s website.
| Date | Status | Borrower | Loan Amount |
|---|---|---|---|
| Open | $129,200 | ||
| Closed | $129,200 |
Tax History
We collect this data history from publicly available records. To have your information removed, we recommend requesting removal directly through your county’s website.
| Year | Tax Paid | Tax Assessment Tax Assessment Total Assessment is a certain percentage of the fair market value that is determined by local assessors to be the total taxable value of land and additions on the property. | Land | Improvement |
|---|---|---|---|---|
| 2025 | $2,351 | $248,800 | $112,000 | $136,800 |
| 2024 | $2,858 | $310,700 | $119,500 | $191,200 |
| 2023 | $3,310 | $231,500 | $101,700 | $129,800 |
| 2022 | $3,195 | $231,500 | $101,700 | $129,800 |
| 2021 | $3,125 | $231,500 | $101,700 | $129,800 |
| 2020 | $3,102 | $231,500 | $101,700 | $129,800 |
| 2019 | $3,216 | $240,000 | $101,700 | $138,300 |
| 2018 | $2,724 | $201,800 | $101,700 | $100,100 |
| 2016 | $2,526 | $196,000 | $101,700 | $94,300 |
| 2015 | $2,528 | $196,000 | $101,700 | $94,300 |
| 2014 | $2,353 | $182,400 | $101,700 | $80,700 |
Map
- 22 High Rd
- Lot #2 Jordan Heights Rd
- 4 Bridge St
- 48 School St
- 20 Main St
- Lot #11 Jordan Heights Rd
- 96 Maple St
- 27G Pease Hill Rd
- 0 Durgintown Rd
- TBD Sokokis Trail N
- 198 Senator Black Rd
- 620 Ossipee Trail
- 50AC Sawyer Mountain Rd
- 62 & 66 Brownfield Rd
- R05-0023 Tripptown Rd
- 66 Brownfield Rd
- 72 Joe Berry Rd
- 500 Pequawket Trail
- 74 Summer St
- 66 Summer St
Ask me questions while you tour the home.