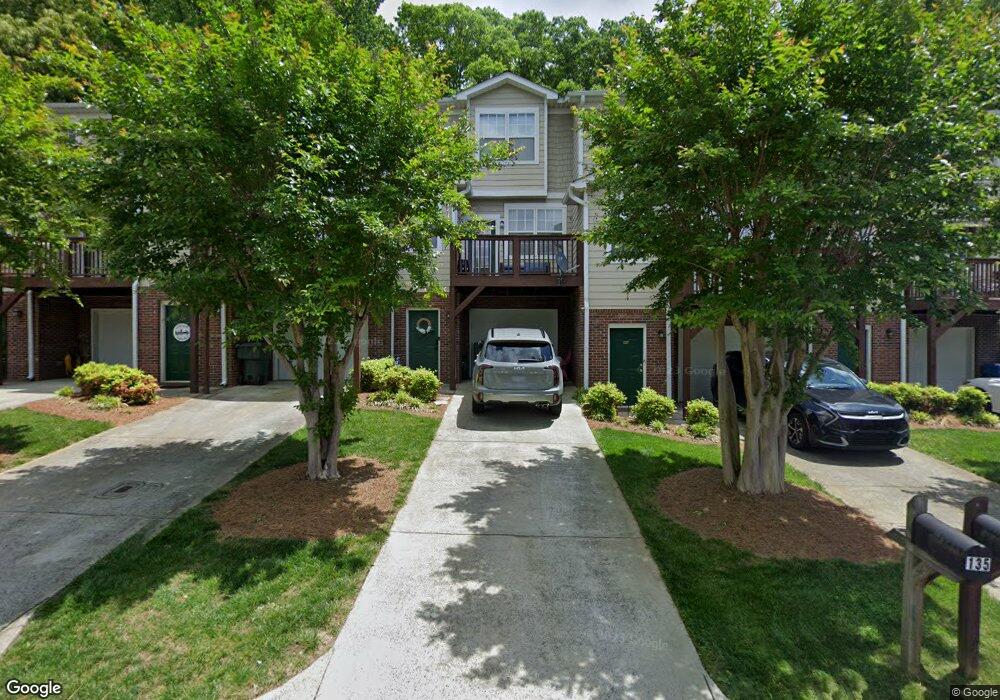
135 High Ridge Rd Mooresville, NC 28117
Estimated Value: $269,288 - $298,000
2
Beds
3
Baths
1,712
Sq Ft
$164/Sq Ft
Est. Value
About This Home
This home is located at 135 High Ridge Rd, Mooresville, NC 28117 and is currently estimated at $281,572, approximately $164 per square foot. 135 High Ridge Rd is a home located in Iredell County with nearby schools including Lake Norman Elementary School, Lake Norman High School, and Langtree Charter Academy.
Ownership History
Date
Name
Owned For
Owner Type
Purchase Details
Closed on
Oct 29, 2018
Sold by
Herr Heather L and Diliberto Bryan
Bought by
Peyton Kelsey Rose
Current Estimated Value
Home Financials for this Owner
Home Financials are based on the most recent Mortgage that was taken out on this home.
Original Mortgage
$156,100
Outstanding Balance
$136,694
Interest Rate
4.6%
Mortgage Type
New Conventional
Estimated Equity
$144,878
Purchase Details
Closed on
Nov 18, 2015
Sold by
Herr Heather L and Diliberto Bryan
Bought by
Herr Heather L and Diliberto Bryan
Purchase Details
Closed on
Jul 30, 2012
Sold by
Brown Wayne A and Brown Brenda
Bought by
Herr Heather L
Home Financials for this Owner
Home Financials are based on the most recent Mortgage that was taken out on this home.
Original Mortgage
$108,007
Interest Rate
3.75%
Mortgage Type
FHA
Purchase Details
Closed on
Nov 3, 2005
Sold by
Sunridge Townhomes Llc
Bought by
Brown Wayne A
Create a Home Valuation Report for This Property
The Home Valuation Report is an in-depth analysis detailing your home's value as well as a comparison with similar homes in the area
Home Values in the Area
Average Home Value in this Area
Purchase History
| Date | Buyer | Sale Price | Title Company |
|---|---|---|---|
| Peyton Kelsey Rose | $161,000 | Barristers Title Services | |
| Herr Heather L | -- | None Available | |
| Herr Heather L | $113,500 | None Available | |
| Brown Wayne A | $122,000 | -- |
Source: Public Records
Mortgage History
| Date | Status | Borrower | Loan Amount |
|---|---|---|---|
| Open | Peyton Kelsey Rose | $156,100 | |
| Previous Owner | Herr Heather L | $108,007 |
Source: Public Records
Tax History Compared to Growth
Tax History
| Year | Tax Paid | Tax Assessment Tax Assessment Total Assessment is a certain percentage of the fair market value that is determined by local assessors to be the total taxable value of land and additions on the property. | Land | Improvement |
|---|---|---|---|---|
| 2024 | $2,826 | $260,490 | $40,000 | $220,490 |
| 2023 | $2,766 | $260,490 | $40,000 | $220,490 |
| 2022 | $1,963 | $159,570 | $25,000 | $134,570 |
| 2021 | $1,959 | $159,570 | $25,000 | $134,570 |
| 2020 | $1,959 | $159,570 | $25,000 | $134,570 |
| 2019 | $1,943 | $159,570 | $25,000 | $134,570 |
| 2018 | $1,523 | $121,970 | $20,000 | $101,970 |
| 2017 | $1,463 | $121,970 | $20,000 | $101,970 |
| 2016 | $1,463 | $121,970 | $20,000 | $101,970 |
| 2015 | $1,463 | $121,970 | $20,000 | $101,970 |
| 2014 | $1,455 | $126,070 | $20,000 | $106,070 |
Source: Public Records
Map
Nearby Homes
- 115 Sunridge Dr
- 220 Chandeleur Dr
- 130 S Gibbs Rd
- 207 Chandeleur Dr
- 159 S Gibbs Rd
- 124 Clipper Ln
- 117 Biscayne Ct
- 103 Pamlico Ln
- 131 Diamond Dr
- 584 Williamson Rd
- 245 Rose St
- 315 W Waterlynn Rd
- 111 Beverly Chase Ln
- 107 Winterberry St
- 167 N Arcadian Way
- 310 W Waterlynn Rd
- 637 Williamson Rd Unit 304
- 157 Talbert Town Loop
- 119 Winterberry St
- 195 Sundown Rd
- 135 High Ridge Rd Unit 63
- 137 High Ridge Rd
- 137 High Ridge Rd Unit 64
- 133 High Ridge Rd
- 131 High Ridge Rd
- 129 High Ridge Rd
- 0 High Ridge Rd Unit A
- 127 High Ridge Rd Unit 3E
- 145 High Ridge Rd
- 145 High Ridge Rd Unit 67
- 125 High Ridge Rd
- 125 High Ridge Rd Unit 58
- 143 High Ridge Rd
- 177 Forest Ridge Rd
- 179 Forest Ridge Rd
- 147 High Ridge Rd
- 181 Forest Ridge Rd
- 175 Sunridge Dr
- 123 High Ridge Rd
- 173 Forest Ridge Rd