135 Hill Rd Jefferson No. 4 Precinct, IL 62938
Estimated payment $3,498/month
About This Lot
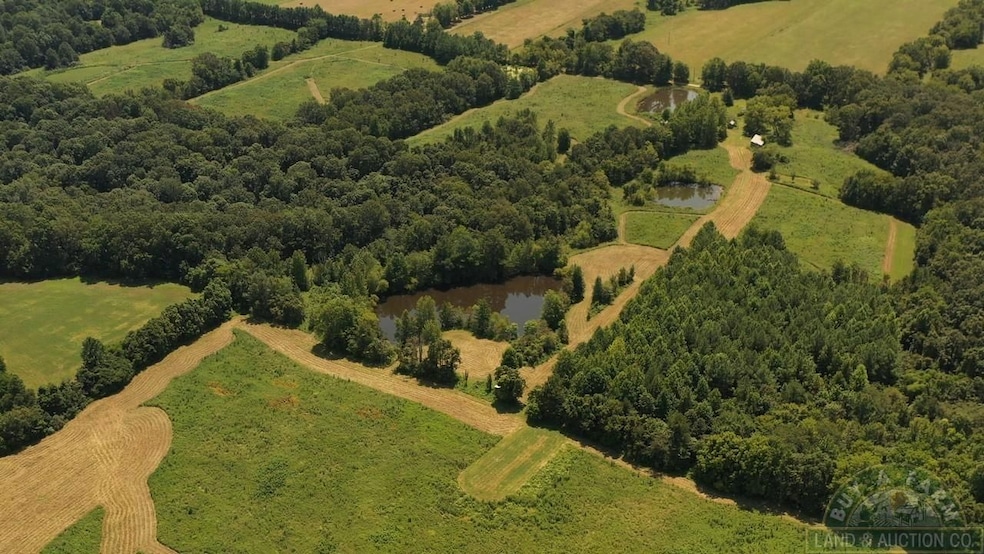
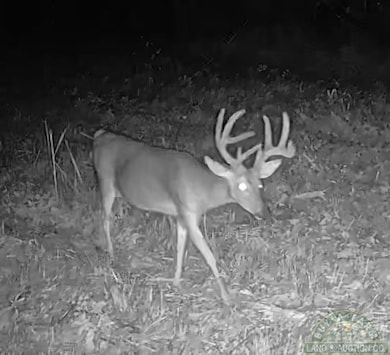
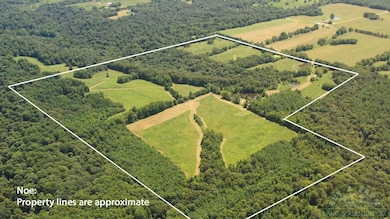
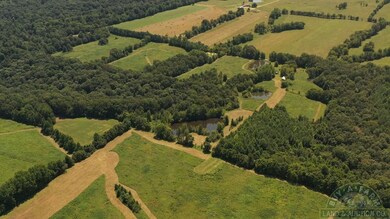
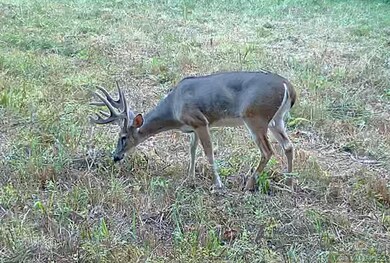
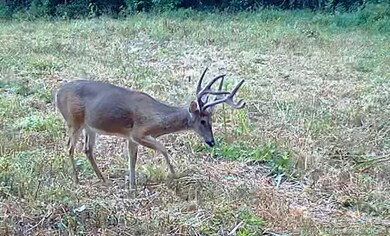
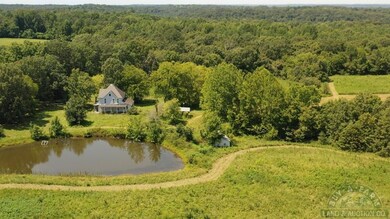
This is one of the prettiest farms you will find in Pope County Illinois, and the hunting is outstanding, both Whitetail and Turkey. The property is gently rolling with various fields, wood lines and 3 ponds. The farm has a very good hunt history and is secluded along a dead end road with a 40-acre length on the north side adjoining the Shawnee National Forest. There is a water well and electric but the home is uninhabitable. An open front shed and a small pole building provide storage.
83.09 acres CRP - pays $9,460 yearly. See attached contracts.
Contract 11022, 1.20 acres pays $175 yearly until 9/30/2025
Contract 11078, 22.12 acres pays $2,933 yearly until 9/30/2027
Contract 11021, 3.21 acres pays $540 yearly until 9/30/2030
Contract 11230, 56.56 acres pays $5,812 yearly until 9/30/2033
Older 2-story farm home in poor repair (uninhabitable)
3 ponds 5 food plots
Frontage on Hill Road (135 Hill Road, Golconda, IL)
Buyer will be required to assume CRP contracts.
Chestnut and Oak and Persimmon trees planted on the SE 40.
Blinds and Tree Stands will stay.

Property Details
Property Type
- Land
Est. Annual Taxes
- $2,687
Map
Home Values in the Area
Average Home Value in this Area
Tax History
| Year | Tax Paid | Tax Assessment Tax Assessment Total Assessment is a certain percentage of the fair market value that is determined by local assessors to be the total taxable value of land and additions on the property. | Land | Improvement |
|---|---|---|---|---|
| 2024 | $2,687 | $55,062 | $45,760 | $9,302 |
| 2023 | $2,687 | $48,978 | $39,676 | $9,302 |
| 2022 | $2,483 | $42,960 | $33,348 | $9,612 |
| 2021 | $2,298 | $49,259 | $28,275 | $20,984 |
| 2020 | $2,021 | $33,013 | $23,675 | $9,338 |
| 2019 | $1,799 | $28,466 | $19,434 | $9,032 |
| 2018 | $1,555 | $24,409 | $15,597 | $8,812 |
| 2017 | $1,915 | $35,748 | $16,024 | $19,724 |
| 2016 | $1,664 | $31,769 | $12,811 | $18,958 |
| 2015 | -- | $32,497 | $12,888 | $19,609 |
| 2014 | -- | $25,969 | $7,879 | $18,090 |
| 2013 | -- | $23,619 | $7,160 | $16,459 |
Property History
| Date | Event | Price | Change | Sq Ft Price |
|---|---|---|---|---|
| 08/13/2024 08/13/24 | For Sale | $620,000 | -- | -- |
Purchase History
| Date | Type | Sale Price | Title Company |
|---|---|---|---|
| Deed | -- | -- |
- 0 Prospect Rd
- 0 Ropers Landing Rd Unit LotWP001
- 159 Jones Orchard Rd
- Shedville Rd
- 7059 Midway Rd
- 0 Fritz Korte Rd Unit LotWP001
- 866 Bay City Rd
- 2 Ac +/- Grasty Rd
- 0000 Ben Shaw Rd
- 5504 Marion Rd
- 27 Grasty Rd
- 18 Old Golconda Rd
- 1016 Adams St
- 1073 Bay City Rd
- 00 Lewis St
- Illinois 146
- 000
- 1600 Albert St
- Grasty Rd
- 000 Midway Rd
- 411 N 7th St Unit 1
- 219 Broadway St
- 302 N 7th St Unit 2
- 111 Market House Square Unit 201
- 525 Broadway St
- 430 Adams St
- 326 N 16th St
- 2208 Park Ave
- 1401 Jefferson St
- 820 Washington St
- 1757 Monroe St
- 3239 Jack Gray Dr
- 3730 Hinkleville Rd
- 5245 Enterprise Dr
- 5251 Hinkleville Rd Unit 5310 Harris Road
- 2651 Perkins Creek Dr
- 2150 Irvin Cobb Dr
- 750 Leiberman St
- 3712 Clarks River Rd
- 256 Glenn St Unit 256 Glenn