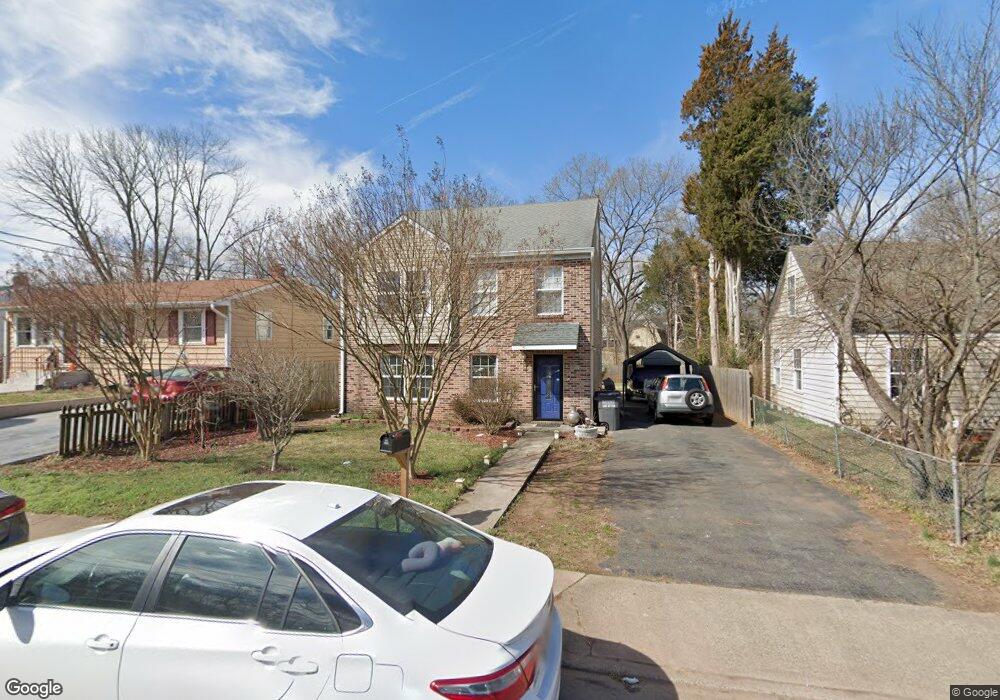
135 Kent Dr Manassas Park, VA 20111
Estimated Value: $445,000 - $606,000
3
Beds
2
Baths
2,785
Sq Ft
$193/Sq Ft
Est. Value
About This Home
This home is located at 135 Kent Dr, Manassas Park, VA 20111 and is currently estimated at $537,853, approximately $193 per square foot. 135 Kent Dr is a home located in Manassas Park City with nearby schools including Cougar Elementary School, Manassas Park Elementary School, and Manassas Park Middle School.
Ownership History
Date
Name
Owned For
Owner Type
Purchase Details
Closed on
Oct 23, 2011
Sold by
Sok Siya and Kim Chhiv K
Bought by
Sok Siya and Kim Chhiv K
Current Estimated Value
Purchase Details
Closed on
Apr 6, 2006
Sold by
Sanchez Jose A
Bought by
Sok Siya
Home Financials for this Owner
Home Financials are based on the most recent Mortgage that was taken out on this home.
Original Mortgage
$235,920
Interest Rate
6.26%
Mortgage Type
New Conventional
Create a Home Valuation Report for This Property
The Home Valuation Report is an in-depth analysis detailing your home's value as well as a comparison with similar homes in the area
Home Values in the Area
Average Home Value in this Area
Purchase History
| Date | Buyer | Sale Price | Title Company |
|---|---|---|---|
| Sok Siya | -- | Tri County Titles | |
| Sok Siya | $294,900 | -- |
Source: Public Records
Mortgage History
| Date | Status | Borrower | Loan Amount |
|---|---|---|---|
| Previous Owner | Sok Siya | $235,920 |
Source: Public Records
Tax History Compared to Growth
Tax History
| Year | Tax Paid | Tax Assessment Tax Assessment Total Assessment is a certain percentage of the fair market value that is determined by local assessors to be the total taxable value of land and additions on the property. | Land | Improvement |
|---|---|---|---|---|
| 2025 | $6,687 | $568,800 | $156,500 | $412,300 |
| 2024 | $6,687 | $510,000 | $142,300 | $367,700 |
| 2023 | $6,687 | $463,600 | $113,800 | $349,800 |
| 2022 | $6,409 | $450,100 | $108,400 | $341,700 |
| 2021 | $6,072 | $409,100 | $94,200 | $314,900 |
| 2020 | $5,709 | $382,300 | $85,600 | $296,700 |
| 2019 | $5,709 | $358,900 | $78,500 | $280,400 |
| 2018 | $5,011 | $338,500 | $74,000 | $264,500 |
| 2017 | $0 | $322,300 | $74,000 | $248,300 |
| 2016 | $4,873 | $314,400 | $74,000 | $240,400 |
| 2015 | $3,977 | $314,400 | $74,000 | $240,400 |
| 2014 | $3,977 | $281,900 | $74,000 | $207,900 |
Source: Public Records
Map
Nearby Homes
- 118 Mace St
- 103 Colfax Dr
- 7924 Manassas Dr
- 304 Manassas Dr
- 7726 Amherst Dr
- 7703 Amherst Dr
- 9412 Westmoreland Ave
- 9370 Fernwood Ct
- 259 Moseby Dr
- 230 Cabbel Dr
- 8334 Shady Grove Cir
- 9405 Blackstone Rd
- 9422 King George Dr
- 248 Manassas Dr
- 8347 Ivy Glen Ct
- 9425 Sudley Manor Dr
- 8333 Gaither St
- 8396 Woodline Ct
- 107 Luxor St
- 7526 Alleghany Rd