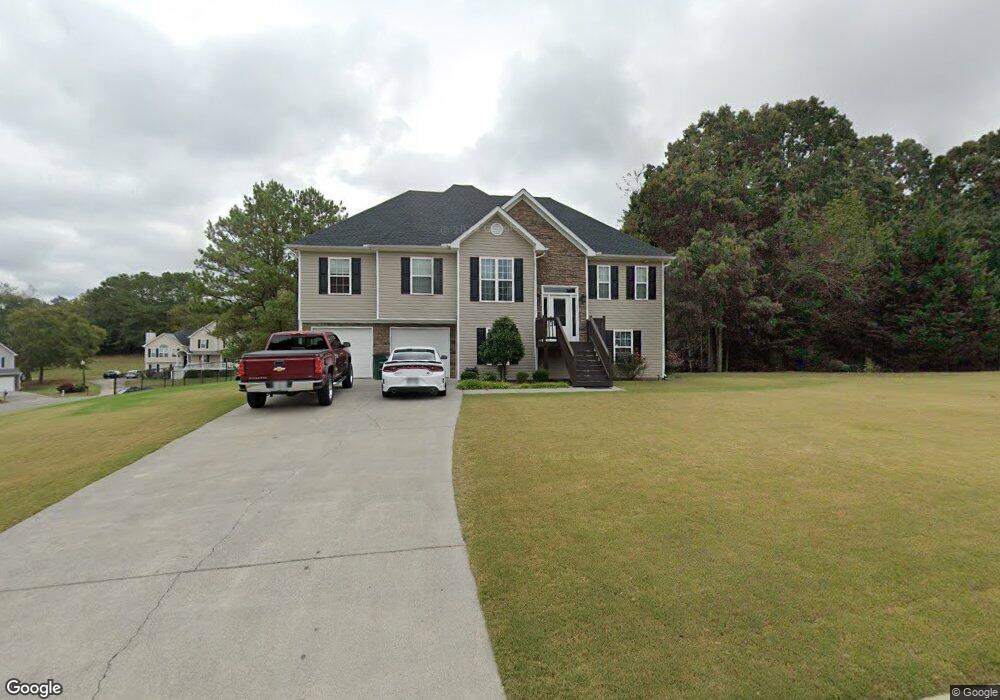
135 Long Pointe Dr SE Calhoun, GA 30701
Estimated Value: $358,000 - $386,000
--
Bed
2
Baths
2,497
Sq Ft
$148/Sq Ft
Est. Value
About This Home
This home is located at 135 Long Pointe Dr SE, Calhoun, GA 30701 and is currently estimated at $368,760, approximately $147 per square foot. 135 Long Pointe Dr SE is a home located in Gordon County with nearby schools including Red Bud Elementary School, Red Bud Middle School, and Sonoraville High School.
Ownership History
Date
Name
Owned For
Owner Type
Purchase Details
Closed on
Sep 4, 2015
Sold by
Mcentyre Philip Scott
Bought by
Mcentyre Philip Scott and Mcentyre Alicia Cassandra
Current Estimated Value
Home Financials for this Owner
Home Financials are based on the most recent Mortgage that was taken out on this home.
Original Mortgage
$164,957
Outstanding Balance
$131,689
Interest Rate
4.4%
Mortgage Type
FHA
Estimated Equity
$237,071
Purchase Details
Closed on
Oct 18, 2007
Sold by
Terramark Properties Inc
Bought by
Cooper Theresa L
Home Financials for this Owner
Home Financials are based on the most recent Mortgage that was taken out on this home.
Original Mortgage
$109,000
Interest Rate
6.27%
Mortgage Type
New Conventional
Purchase Details
Closed on
Mar 8, 2007
Sold by
Longview Llc
Bought by
Terramark Properties Inc
Purchase Details
Closed on
May 22, 2006
Sold by
East Bartow Development Inc
Bought by
East Bartow Development Inc
Create a Home Valuation Report for This Property
The Home Valuation Report is an in-depth analysis detailing your home's value as well as a comparison with similar homes in the area
Home Values in the Area
Average Home Value in this Area
Purchase History
| Date | Buyer | Sale Price | Title Company |
|---|---|---|---|
| Mcentyre Philip Scott | -- | -- | |
| Mcentyre Philip Scott | $168,000 | -- | |
| Cooper Theresa L | $179,900 | -- | |
| Terramark Properties Inc | $28,000 | -- | |
| East Bartow Development Inc | -- | -- |
Source: Public Records
Mortgage History
| Date | Status | Borrower | Loan Amount |
|---|---|---|---|
| Open | Mcentyre Philip Scott | $164,957 | |
| Closed | Mcentyre Philip Scott | $164,957 | |
| Previous Owner | Cooper Theresa L | $109,000 |
Source: Public Records
Tax History Compared to Growth
Tax History
| Year | Tax Paid | Tax Assessment Tax Assessment Total Assessment is a certain percentage of the fair market value that is determined by local assessors to be the total taxable value of land and additions on the property. | Land | Improvement |
|---|---|---|---|---|
| 2024 | $3,199 | $127,920 | $7,400 | $120,520 |
| 2023 | $2,988 | $119,600 | $7,400 | $112,200 |
| 2022 | $3,024 | $111,920 | $7,400 | $104,520 |
| 2021 | $2,377 | $84,840 | $7,400 | $77,440 |
| 2020 | $2,458 | $85,800 | $7,400 | $78,400 |
| 2019 | $2,471 | $85,800 | $7,400 | $78,400 |
| 2018 | $2,288 | $79,440 | $7,400 | $72,040 |
| 2017 | $2,067 | $69,760 | $7,400 | $62,360 |
| 2016 | $1,996 | $69,760 | $7,400 | $62,360 |
| 2015 | $2,051 | $68,400 | $7,400 | $61,000 |
| 2014 | $1,889 | $64,876 | $7,420 | $57,456 |
Source: Public Records
Map
Nearby Homes
- 225 Lovebridge Dr SE
- 254 Gravely Rd SE
- 137 Wendy Hill Rd SE
- 106 Valley View Cir SE
- 119 Windy Hill Rd SE
- 3171 Dews Pond Rd SE
- 279 Baker Rd SE
- 170 Erica Ln SE
- 320 Wrights Hollow Rd SE
- 379 Owens Cir NE
- 170 Willow Haven St SE
- 130 Burnt Hickory Ln SE
- 187 Willow Haven St SE
- 127 Alex Ct
- 140 Washington St SE
- 221 Hunters Crossing SE
- 137 Hunters Trail SE
- 219 Orchard Way SE
- 137 Orchard Way SE
- 123 Long Pointe Dr SE
- 121 Long Ridge Rd SE
- 0 Long Ridge Dr SE Unit 7197744
- 124 Long Pointe Dr SE
- 101 Magnolia Dr SE
- 127 Long Ridge Rd SE
- 102 Long Ridge Rd SE
- 102 Long Ridge Rd SE
- 127 Long View Dr SE
- 118 Long Ridge Rd SE
- 122 Long Ridge Dr SE
- 122 Long Ridge Rd SE
- 109 Long Pointe Dr SE
- 107 Long Ridge Dr SE
- 110 Long Pointe Dr SE
- 141 Long View Dr SE
- 126 Long Ridge Dr SE
- 111 Longview Dr SE
- 123 Long Ridge Dr SE
- 127 Long Pointe Rd SE