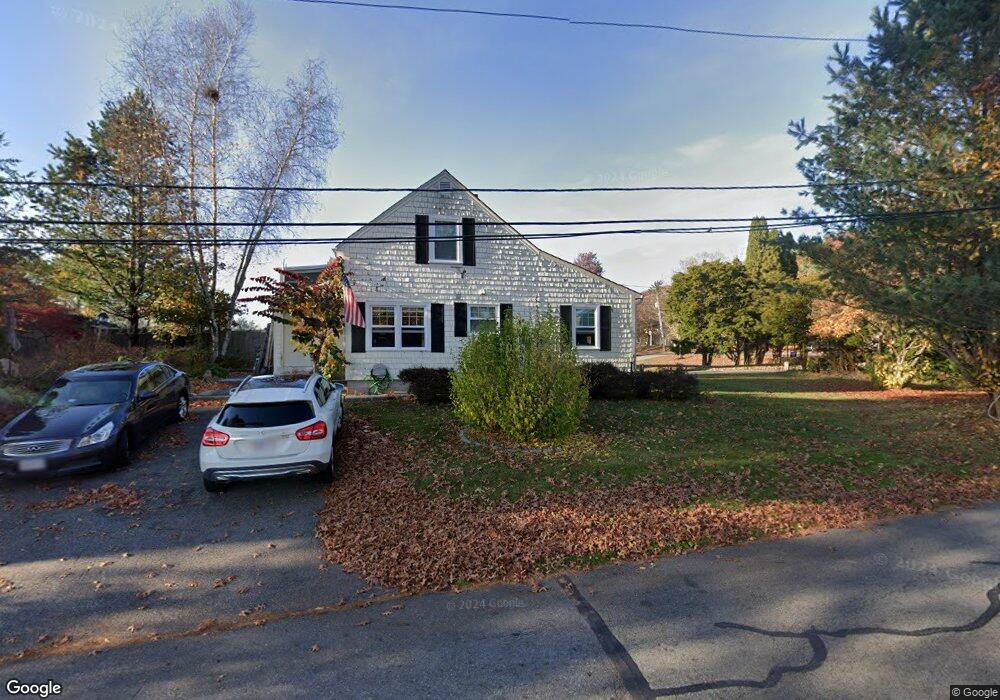
135 Low St Newburyport, MA 01950
Estimated Value: $662,859 - $765,000
2
Beds
1
Bath
940
Sq Ft
$765/Sq Ft
Est. Value
About This Home
This home is located at 135 Low St, Newburyport, MA 01950 and is currently estimated at $719,465, approximately $765 per square foot. 135 Low St is a home located in Essex County with nearby schools including Francis T. Bresnahan Elementary School, Edward G. Molin Elementary School, and Rupert A. Nock Middle School.
Ownership History
Date
Name
Owned For
Owner Type
Purchase Details
Closed on
May 6, 2005
Sold by
Odonnell Philip K
Bought by
Jackson Adrianne N
Current Estimated Value
Home Financials for this Owner
Home Financials are based on the most recent Mortgage that was taken out on this home.
Original Mortgage
$95,000
Outstanding Balance
$50,073
Interest Rate
6.01%
Mortgage Type
Purchase Money Mortgage
Estimated Equity
$669,392
Purchase Details
Closed on
Nov 4, 1999
Sold by
Fhlmc
Bought by
Odonnell Philip K
Purchase Details
Closed on
Jul 26, 1999
Sold by
Mahoney Mark T and Mellon Mtg Co
Bought by
Fhlmc
Purchase Details
Closed on
Feb 28, 1995
Sold by
Poitras Robert E and Poitras Thelma
Bought by
Mahoney Mark T and Mahoney Stephanie
Create a Home Valuation Report for This Property
The Home Valuation Report is an in-depth analysis detailing your home's value as well as a comparison with similar homes in the area
Home Values in the Area
Average Home Value in this Area
Purchase History
| Date | Buyer | Sale Price | Title Company |
|---|---|---|---|
| Jackson Adrianne N | $324,000 | -- | |
| Odonnell Philip K | $152,500 | -- | |
| Fhlmc | $134,622 | -- | |
| Mahoney Mark T | $124,500 | -- |
Source: Public Records
Mortgage History
| Date | Status | Borrower | Loan Amount |
|---|---|---|---|
| Open | Mahoney Mark T | $95,000 | |
| Previous Owner | Mahoney Mark T | $61,000 |
Source: Public Records
Tax History Compared to Growth
Tax History
| Year | Tax Paid | Tax Assessment Tax Assessment Total Assessment is a certain percentage of the fair market value that is determined by local assessors to be the total taxable value of land and additions on the property. | Land | Improvement |
|---|---|---|---|---|
| 2025 | $5,648 | $589,600 | $380,700 | $208,900 |
| 2024 | $5,352 | $536,800 | $346,100 | $190,700 |
| 2023 | $5,280 | $491,600 | $300,900 | $190,700 |
| 2022 | $4,963 | $413,200 | $250,800 | $162,400 |
| 2021 | $4,650 | $367,900 | $228,000 | $139,900 |
| 2020 | $4,644 | $361,700 | $228,000 | $133,700 |
| 2019 | $4,604 | $352,000 | $228,000 | $124,000 |
| 2018 | $4,449 | $335,500 | $217,100 | $118,400 |
| 2017 | $4,328 | $321,800 | $206,800 | $115,000 |
| 2016 | $4,171 | $311,500 | $197,000 | $114,500 |
| 2015 | $4,037 | $302,600 | $197,000 | $105,600 |
Source: Public Records
Map
Nearby Homes
- 138 Low St
- 110 Low St
- 287 1/2 High St
- 42 Myrtle Ave
- 17 Alberta Ave
- 14 Dexter Ln Unit B
- 14 Dexter Ln Unit A
- 13 Broad St
- 27 Warren St Unit 1
- 217 Merrimac St Unit 1
- 288 Merrimac St
- 45 Boardman St Unit 1
- 41 Washington St Unit B
- 44 Washington St Unit C
- 266 Merrimac St Unit F
- 158 Merrimac St Unit 3
- 232 Low St Unit 7
- 6 Storey Ave
- 19 Jefferson St
- 126 Merrimac St Unit 35