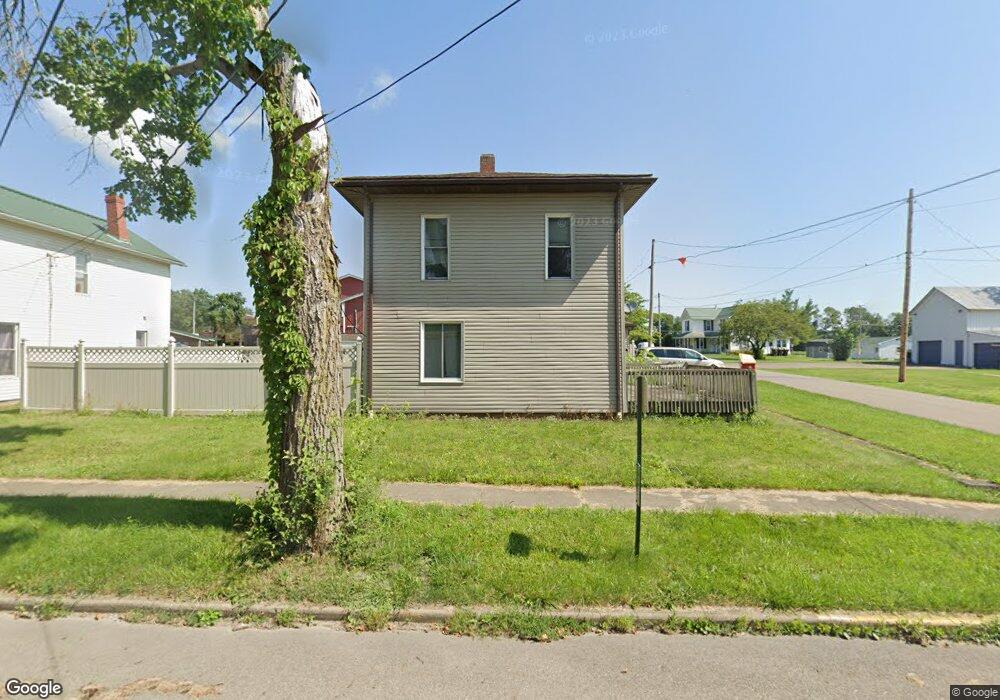
135 Main St Holmesville, OH 44633
Estimated Value: $176,700 - $270,000
2
Beds
2
Baths
1,585
Sq Ft
$139/Sq Ft
Est. Value
About This Home
This home is located at 135 Main St, Holmesville, OH 44633 and is currently estimated at $220,425, approximately $139 per square foot. 135 Main St is a home with nearby schools including Waynedale High School, DIAMOND VIEW, and Country Lane.
Ownership History
Date
Name
Owned For
Owner Type
Purchase Details
Closed on
Jan 29, 2021
Sold by
Baker Ferkan James T and Baker Ferkan Elizabeth
Bought by
Baker Ferkan James T and Baker Ferkan Elizabeth
Current Estimated Value
Home Financials for this Owner
Home Financials are based on the most recent Mortgage that was taken out on this home.
Original Mortgage
$104,500
Outstanding Balance
$93,302
Interest Rate
2.6%
Mortgage Type
New Conventional
Estimated Equity
$127,123
Purchase Details
Closed on
Sep 5, 2017
Sold by
Hershberger Lori J and Troyer Lori J
Bought by
Baker James T and Baker Elizabeth D
Home Financials for this Owner
Home Financials are based on the most recent Mortgage that was taken out on this home.
Original Mortgage
$106,700
Interest Rate
3.9%
Mortgage Type
New Conventional
Purchase Details
Closed on
Dec 15, 2000
Bought by
Hilty Ivan P and Ella Js
Purchase Details
Closed on
Jan 1, 1990
Bought by
Miller Leroy J
Create a Home Valuation Report for This Property
The Home Valuation Report is an in-depth analysis detailing your home's value as well as a comparison with similar homes in the area
Home Values in the Area
Average Home Value in this Area
Purchase History
| Date | Buyer | Sale Price | Title Company |
|---|---|---|---|
| Baker Ferkan James T | -- | None Available | |
| Baker James T | $109,875 | None Available | |
| Hilty Ivan P | $70,000 | -- | |
| Miller Leroy J | -- | -- |
Source: Public Records
Mortgage History
| Date | Status | Borrower | Loan Amount |
|---|---|---|---|
| Open | Baker Ferkan James T | $104,500 | |
| Closed | Baker James T | $106,700 |
Source: Public Records
Tax History Compared to Growth
Tax History
| Year | Tax Paid | Tax Assessment Tax Assessment Total Assessment is a certain percentage of the fair market value that is determined by local assessors to be the total taxable value of land and additions on the property. | Land | Improvement |
|---|---|---|---|---|
| 2024 | $1,625 | $39,840 | $6,130 | $33,710 |
| 2023 | $1,625 | $39,840 | $6,130 | $33,710 |
| 2022 | $1,684 | $39,840 | $6,130 | $33,710 |
| 2021 | $1,433 | $32,290 | $5,160 | $27,130 |
| 2020 | $1,448 | $32,290 | $5,160 | $27,130 |
| 2019 | $1,417 | $32,290 | $5,160 | $27,130 |
| 2018 | $1,245 | $29,100 | $4,840 | $24,260 |
| 2017 | $1,263 | $29,100 | $4,840 | $24,260 |
| 2016 | $1,276 | $29,100 | $4,840 | $24,260 |
| 2015 | $1,151 | $25,650 | $4,790 | $20,860 |
| 2014 | $1,156 | $25,650 | $4,790 | $20,860 |
| 2013 | $610 | $25,650 | $4,790 | $20,860 |
Source: Public Records
Map
Nearby Homes
- V/L County Road 201
- 151 Quinn Cir
- 1025 Willow Dr
- 1026 Willow Dr
- 1024 Willow Dr
- 1023 Willow Dr
- V/L Township Road 605
- V/L Township Road 605
- 126 Stony Creek Dr
- 1012 Beech Ave
- 1010 Beech Ave
- 1008 Beech Ave
- 591 N Mill St Unit B
- 591 N Mill St Unit D
- 591 N Mill St
- 591 N Mill St Unit C
- 591 N Mill St Unit A
- 1003 Sycamore Ln
- 1009 Sycamore Ln
- 995 Beech Ave
- 117 E Main St
- 113 Main St
- 126 E Jackson St
- 134 E Jackson St
- 142 E Jackson St
- 109 Jackson St
- 110 Taylor St
- 102 Taylor St
- 106 Main St
- 111 E Jackson St
- 110 N Millersburg St
- 202 Main St
- 213 E Main St
- 210 Main St
- 107 S Millersburg St
- 110 S Taylor St
- 105 S Wood St
- 111 Jackson St
- 109 N Wood St
- 114 Taylor St