
Landlord's Agent in 2025
Steve Savarese
Senne
(617) 962-4823
84 Total Sales
Estimated Value: $1,161,000 - $1,536,000
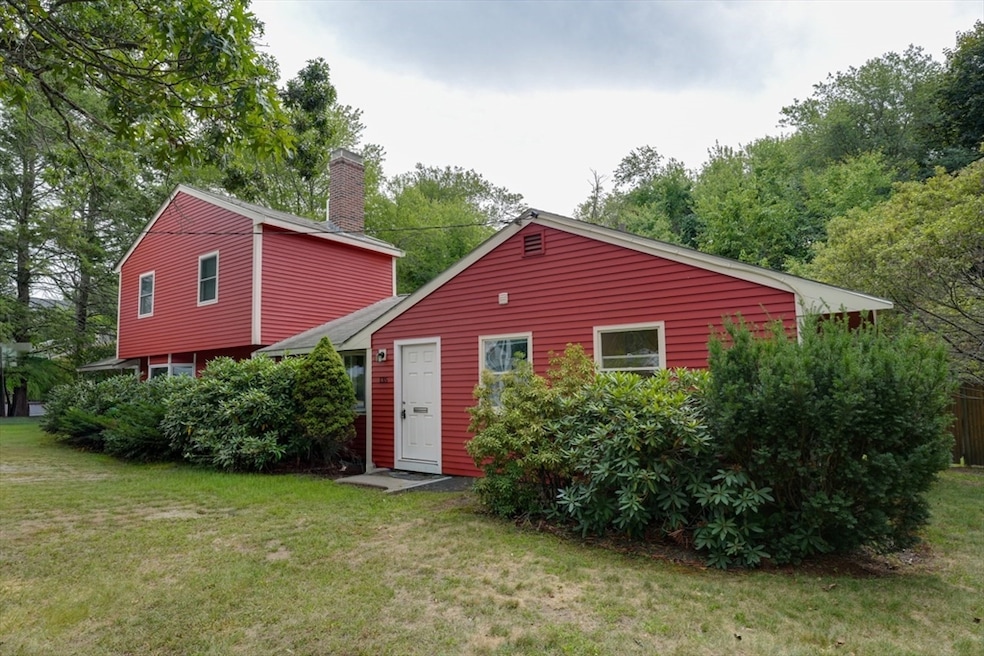
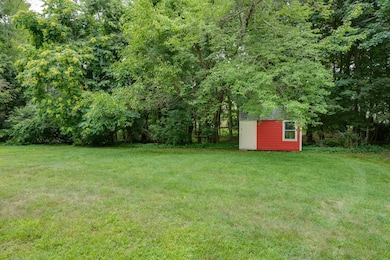
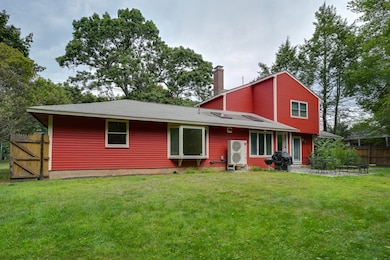
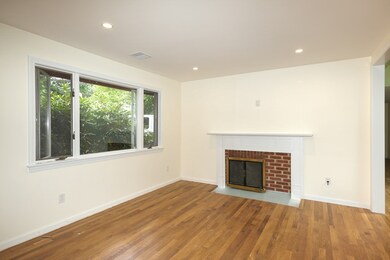
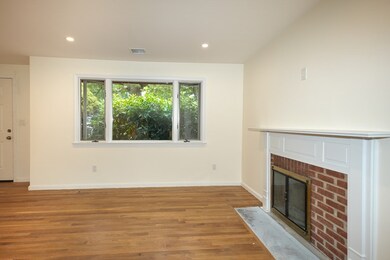
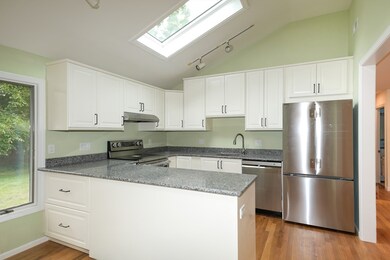
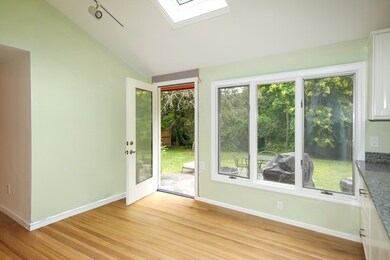
Renovated and ready to welcome its first resident, this charming home combines modern comfort, abundant natural light, and a prime location close to restaurants, supermarkets, and several convenience stores. New Heat pump includes central air conditioning. 8 rooms, 4 bedrooms, and 2 baths The first floor offers 3 bedrooms, a full bath, a cozy living room, and an open kitchen with vaulted ceilings, a skylight and dining area with glass door to the yard and large windows that fill the space with natural light. There is also a beautiful family room, ideal for relaxing and entertaining. Upstairs features an elegant primary suite with a spacious walk-in closet and a large bathroom, as well as a charming additional area perfect for a home office or reading nook. The property also includes a generous backyard, perfect for enjoying sunny days with friends and family. Come visit this beautiful home and become part of Lexington’s warm and welcoming community!
| Date | Buyer | Sale Price | Title Company |
|---|---|---|---|
| Chamon Claudio C | $320,000 | -- | |
| Hitchcock Antoinette F | $225,000 | -- | |
| Hopkins Stephen W | $200,000 | -- |
| Date | Status | Borrower | Loan Amount |
|---|---|---|---|
| Open | Hopkins Stephen W | $315,800 | |
| Closed | Hopkins Stephen W | $337,380 | |
| Closed | Hopkins Stephen W | $364,000 |
| Date | Event | Price | List to Sale | Price per Sq Ft |
|---|---|---|---|---|
| 12/23/2025 12/23/25 | Rented | $5,000 | -9.1% | -- |
| 11/11/2025 11/11/25 | For Rent | $5,500 | -- | -- |
| Year | Tax Paid | Tax Assessment Tax Assessment Total Assessment is a certain percentage of the fair market value that is determined by local assessors to be the total taxable value of land and additions on the property. | Land | Improvement |
|---|---|---|---|---|
| 2025 | $13,233 | $1,082,000 | $614,000 | $468,000 |
| 2024 | $12,863 | $1,050,000 | $584,000 | $466,000 |
| 2023 | $12,116 | $932,000 | $531,000 | $401,000 |
| 2022 | $11,261 | $816,000 | $483,000 | $333,000 |
| 2021 | $9,027 | $779,000 | $460,000 | $319,000 |
| 2020 | $11,085 | $789,000 | $460,000 | $329,000 |
| 2019 | $10,774 | $763,000 | $438,000 | $325,000 |
| 2018 | $11,584 | $736,000 | $417,000 | $319,000 |
| 2017 | $9,204 | $662,000 | $397,000 | $265,000 |
| 2016 | $8,862 | $607,000 | $374,000 | $233,000 |
| 2015 | $8,589 | $578,000 | $340,000 | $238,000 |
| 2014 | $8,267 | $533,000 | $309,000 | $224,000 |
Landlord's Agent in 2025
Steve Savarese
Senne
(617) 962-4823
84 Total Sales
Source: MLS Property Information Network (MLS PIN)
MLS Number: 73453586
APN: LEXI-000038-000000-000023
Disclaimer: Certain information contained herein is derived from information provided by parties other than Homes.com. All information provided is deemed reliable, but is not guaranteed to be accurate and should be independently verified.
![]() The property listing data and information, or the Images, set forth herein were provided to MLS Property Information Network, Inc. from third party sources, including sellers, lessors and public records, and were compiled by MLS Property Information Network, Inc. The property listing data and information, and the Images, are for the personal, non-commercial use of consumers having a good faith interest in purchasing or leasing listed properties of the type displayed to them and may not be used for any purpose other than to identify prospective properties which such consumers may have a good faith interest in purchasing or leasing. MLS Property Information Network, Inc. and its subscribers disclaim any and all representations and warranties as to the accuracy of the property listing data and information, or as to the accuracy of any of the Images, set forth herein.
The property listing data and information, or the Images, set forth herein were provided to MLS Property Information Network, Inc. from third party sources, including sellers, lessors and public records, and were compiled by MLS Property Information Network, Inc. The property listing data and information, and the Images, are for the personal, non-commercial use of consumers having a good faith interest in purchasing or leasing listed properties of the type displayed to them and may not be used for any purpose other than to identify prospective properties which such consumers may have a good faith interest in purchasing or leasing. MLS Property Information Network, Inc. and its subscribers disclaim any and all representations and warranties as to the accuracy of the property listing data and information, or as to the accuracy of any of the Images, set forth herein.
Ask me questions while you tour the home.