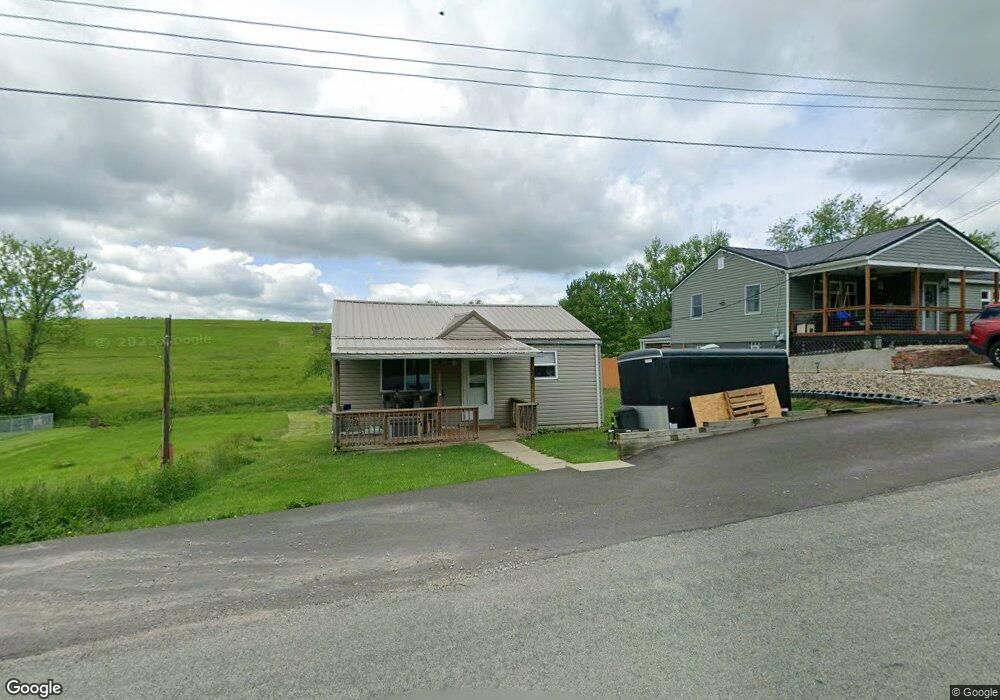
135 Midway Candor Rd Bulger, PA 15019
Robinson Township NeighborhoodEstimated Value: $191,000 - $201,000
3
Beds
2
Baths
1,038
Sq Ft
$190/Sq Ft
Est. Value
About This Home
This home is located at 135 Midway Candor Rd, Bulger, PA 15019 and is currently estimated at $196,779, approximately $189 per square foot. 135 Midway Candor Rd is a home located in Washington County with nearby schools including Fort Cherry Elementary Center and Fort Cherry Junior-Senior High School.
Ownership History
Date
Name
Owned For
Owner Type
Purchase Details
Closed on
Jun 14, 2021
Sold by
Wissinger Ryan H and Wissinger Vanessa
Bought by
Paschuck Paul A
Current Estimated Value
Home Financials for this Owner
Home Financials are based on the most recent Mortgage that was taken out on this home.
Original Mortgage
$162,000
Outstanding Balance
$146,671
Interest Rate
2.9%
Mortgage Type
VA
Estimated Equity
$50,108
Purchase Details
Closed on
Feb 22, 2019
Sold by
Francken Joan E
Bought by
Wissinger Ryan H and Wissinger Vanessa
Home Financials for this Owner
Home Financials are based on the most recent Mortgage that was taken out on this home.
Original Mortgage
$136,262
Interest Rate
4.4%
Mortgage Type
New Conventional
Purchase Details
Closed on
Jan 5, 2001
Sold by
Hill Christopher
Bought by
Fracken Joan
Home Financials for this Owner
Home Financials are based on the most recent Mortgage that was taken out on this home.
Original Mortgage
$49,608
Interest Rate
7.64%
Create a Home Valuation Report for This Property
The Home Valuation Report is an in-depth analysis detailing your home's value as well as a comparison with similar homes in the area
Home Values in the Area
Average Home Value in this Area
Purchase History
| Date | Buyer | Sale Price | Title Company |
|---|---|---|---|
| Paschuck Paul A | $162,000 | Keymax Settlement Svcs Llc | |
| Wissinger Ryan H | $134,900 | None Available | |
| Fracken Joan | $50,000 | -- |
Source: Public Records
Mortgage History
| Date | Status | Borrower | Loan Amount |
|---|---|---|---|
| Open | Paschuck Paul A | $162,000 | |
| Previous Owner | Wissinger Ryan H | $136,262 | |
| Previous Owner | Fracken Joan | $49,608 |
Source: Public Records
Tax History Compared to Growth
Tax History
| Year | Tax Paid | Tax Assessment Tax Assessment Total Assessment is a certain percentage of the fair market value that is determined by local assessors to be the total taxable value of land and additions on the property. | Land | Improvement |
|---|---|---|---|---|
| 2025 | $2,660 | $135,700 | $20,300 | $115,400 |
| 2024 | $2,430 | $135,700 | $20,300 | $115,400 |
| 2023 | $2,430 | $135,700 | $20,300 | $115,400 |
| 2022 | $1,740 | $135,700 | $20,300 | $115,400 |
| 2021 | $1,690 | $100,500 | $20,300 | $80,200 |
| 2020 | $1,647 | $100,500 | $20,300 | $80,200 |
| 2019 | $1,610 | $100,500 | $20,300 | $80,200 |
| 2018 | $1,560 | $100,500 | $20,300 | $80,200 |
| 2017 | $152 | $100,500 | $20,300 | $80,200 |
| 2016 | $152 | $6,096 | $555 | $5,541 |
| 2015 | -- | $6,096 | $555 | $5,541 |
| 2014 | $152 | $6,096 | $555 | $5,541 |
| 2013 | $152 | $6,096 | $555 | $5,541 |
Source: Public Records
Map
Nearby Homes
- 305 Railroad St
- 303 North Ave
- 501 Massey Rd
- 10 Fieldcrest Dr
- 0 Robinson Hwy
- 543 Johns Ave
- 1125 Candor Rd
- 1218 Sunset Dr
- 1322 Hidden Valley Rd
- 1328 Hidden Valley Rd
- 1352 Hilltop Dr
- 1340 Hilltop Dr
- 1410 Hidden Valley Rd
- 1412 Hidden Valley Rd
- 1414 Hidden Valley Rd
- 1406 Hidden Valley Rd
- 1408 Hidden Valley Rd
- 27 Manor Dr
- 800 N Branch Rd
- Lot #39 Sunrise Ln
- 139 Midway Candor Rd
- 141 Midway Candor Rd
- 125 Midway Candor Rd
- 123 Midway Candor Rd
- 144 Midway Candor Rd
- 153 Midway Candor Rd
- 111 Midway Candor Rd
- 157 Midway Candor Rd
- 155 Midway Candor Rd
- 112 Midway Candor Rd
- 160 Midway Candor Rd
- 263 Cataney Ln
- 319 Eaton St
- 271 Cataney Ln
- 313 Eaton Ave
- 303 Eaton St
- 308 Washington Ave
- 309 Washington Ave
- 301 Eaton St
- 301 Prospect St