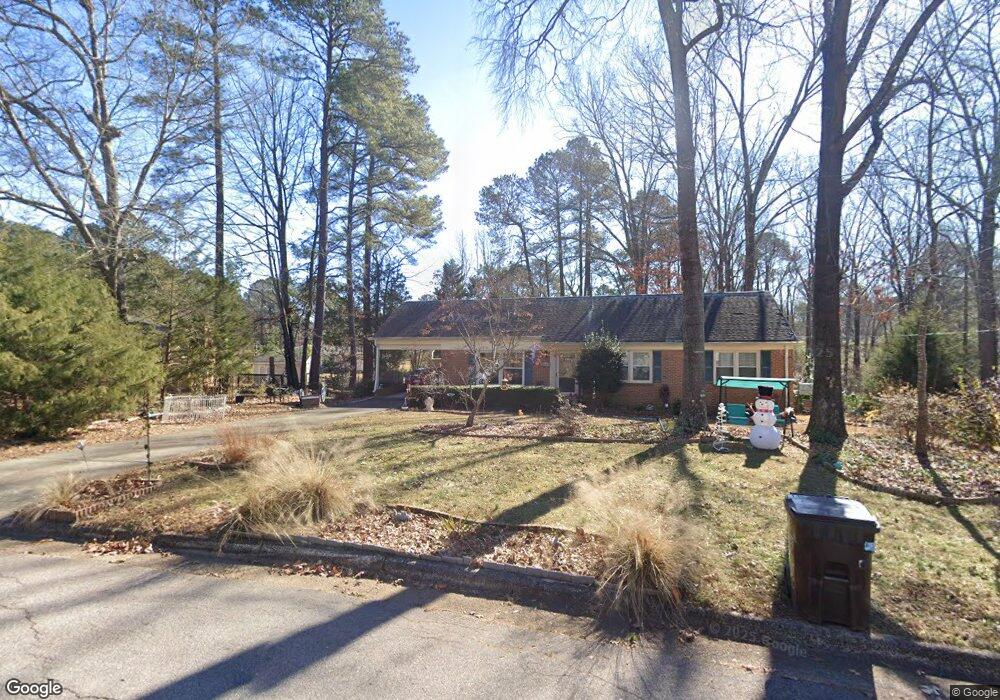
135 Montclair Cir Durham, NC 27713
Estimated Value: $406,000 - $423,000
3
Beds
2
Baths
1,933
Sq Ft
$214/Sq Ft
Est. Value
About This Home
This home is located at 135 Montclair Cir, Durham, NC 27713 and is currently estimated at $413,902, approximately $214 per square foot. 135 Montclair Cir is a home located in Durham County with nearby schools including Parkwood Elementary, Centerville Junior High School, and Lowe's Grove Middle.
Ownership History
Date
Name
Owned For
Owner Type
Purchase Details
Closed on
Oct 27, 2010
Sold by
Davis Russell Warren and Davis Pamela Joy Howell
Bought by
Bennett Vernel D and Bennett Danielle T
Current Estimated Value
Home Financials for this Owner
Home Financials are based on the most recent Mortgage that was taken out on this home.
Original Mortgage
$130,000
Outstanding Balance
$86,208
Interest Rate
4.37%
Mortgage Type
New Conventional
Estimated Equity
$327,694
Purchase Details
Closed on
Aug 15, 2003
Sold by
Jacobs Dwayne L and Jacobs Laura Jo
Bought by
Davis Russell Warren and Howell Pamela Joy
Home Financials for this Owner
Home Financials are based on the most recent Mortgage that was taken out on this home.
Original Mortgage
$140,600
Interest Rate
4.75%
Mortgage Type
Purchase Money Mortgage
Create a Home Valuation Report for This Property
The Home Valuation Report is an in-depth analysis detailing your home's value as well as a comparison with similar homes in the area
Home Values in the Area
Average Home Value in this Area
Purchase History
| Date | Buyer | Sale Price | Title Company |
|---|---|---|---|
| Bennett Vernel D | $175,000 | None Available | |
| Davis Russell Warren | $148,000 | -- |
Source: Public Records
Mortgage History
| Date | Status | Borrower | Loan Amount |
|---|---|---|---|
| Open | Bennett Vernel D | $130,000 | |
| Previous Owner | Davis Russell Warren | $140,600 |
Source: Public Records
Tax History Compared to Growth
Tax History
| Year | Tax Paid | Tax Assessment Tax Assessment Total Assessment is a certain percentage of the fair market value that is determined by local assessors to be the total taxable value of land and additions on the property. | Land | Improvement |
|---|---|---|---|---|
| 2025 | $3,883 | $391,746 | $137,000 | $254,746 |
| 2024 | $3,257 | $233,517 | $41,100 | $192,417 |
| 2023 | $3,059 | $233,517 | $41,100 | $192,417 |
| 2022 | $2,989 | $233,517 | $41,100 | $192,417 |
| 2021 | $2,975 | $233,517 | $41,100 | $192,417 |
| 2020 | $2,905 | $233,517 | $41,100 | $192,417 |
| 2019 | $2,905 | $261,367 | $41,100 | $220,267 |
| 2018 | $2,806 | $206,827 | $30,825 | $176,002 |
| 2017 | $2,785 | $206,827 | $30,825 | $176,002 |
| 2016 | $2,691 | $206,827 | $30,825 | $176,002 |
| 2015 | $2,406 | $173,835 | $33,771 | $140,064 |
| 2014 | $2,406 | $173,835 | $33,771 | $140,064 |
Source: Public Records
Map
Nearby Homes
- 1445 Sedwick Rd
- 5320 Newhall Rd
- 104 Deblyn Ct
- 5504 Pelham Rd
- 6353 Grandale Dr
- 12 Stonehouse Ct
- 1621 Clermont Rd
- 1510 Haventree Rd
- 1304 Seaton Rd Unit 1
- 1304 Seaton Rd Unit 17
- 1304 Seaton Rd Unit 24
- 1227 Seaton Rd Unit 54
- 109 Settlers Mill Ln
- 27 Sunflower Ct
- 1728 Euclid Rd
- 5916 Lyon Farm Dr
- 7409 Chesley Ln
- 1018 Fenwick Pkwy
- 9 Monteith Ct
- 115 Lattimore Ln
- 133 Montclair Cir
- 137 Montclair Cir
- 5600 Buttonwood Ct
- 134 Montclair Cir
- 141 Montclair Cir
- 129 Montclair Cir
- 5601 Buttonwood Ct
- 126 Montclair Cir
- 5511 Newhall Rd
- 5604 Buttonwood Ct
- 140 Montclair Cir
- 5601 Newhall Rd
- 125 Montclair Cir
- 120 Montclair Cir
- 5608 Buttonwood Ct
- 5605 Buttonwood Ct
- 5417 Newhall Rd
- 101 Maybank Ct
- 120 Temple Ln
- 100 Foxcroft Ln