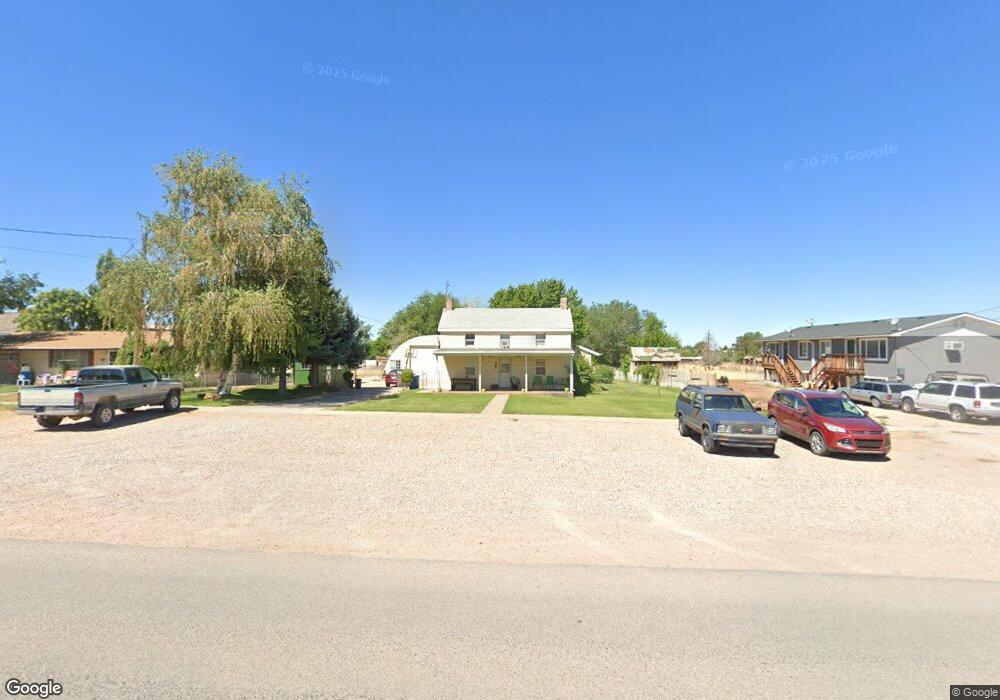
135 N 100 W Fillmore, UT 84631
Estimated Value: $326,000 - $391,000
4
Beds
2
Baths
2,099
Sq Ft
$175/Sq Ft
Est. Value
About This Home
This home is located at 135 N 100 W, Fillmore, UT 84631 and is currently estimated at $366,392, approximately $174 per square foot. 135 N 100 W is a home located in Millard County.
Ownership History
Date
Name
Owned For
Owner Type
Purchase Details
Closed on
Jun 13, 2016
Sold by
Tracy Kevin E
Bought by
Brewer Rebecca K
Current Estimated Value
Home Financials for this Owner
Home Financials are based on the most recent Mortgage that was taken out on this home.
Original Mortgage
$156,120
Interest Rate
3.61%
Mortgage Type
FHA
Purchase Details
Closed on
Jan 14, 2016
Sold by
Tracy Tonya L
Bought by
Tracy Kevin E
Home Financials for this Owner
Home Financials are based on the most recent Mortgage that was taken out on this home.
Original Mortgage
$80,000
Interest Rate
3.92%
Mortgage Type
New Conventional
Purchase Details
Closed on
Mar 14, 2005
Sold by
Barney Beau Brandon and Barney Jennifer
Bought by
Tracy Kevin E and Tracy Tonya L
Home Financials for this Owner
Home Financials are based on the most recent Mortgage that was taken out on this home.
Original Mortgage
$132,000
Interest Rate
5.53%
Mortgage Type
New Conventional
Create a Home Valuation Report for This Property
The Home Valuation Report is an in-depth analysis detailing your home's value as well as a comparison with similar homes in the area
Home Values in the Area
Average Home Value in this Area
Purchase History
| Date | Buyer | Sale Price | Title Company |
|---|---|---|---|
| Brewer Rebecca K | -- | First American Title | |
| Tracy Kevin E | -- | First American Title | |
| Tracy Kevin E | -- | First American Title Insuran |
Source: Public Records
Mortgage History
| Date | Status | Borrower | Loan Amount |
|---|---|---|---|
| Open | Brewer Rebecca K | $150,000 | |
| Closed | Brewer Rebecca K | $156,120 | |
| Previous Owner | Tracy Kevin E | $80,000 | |
| Previous Owner | Tracy Kevin E | $119,000 | |
| Previous Owner | Tracy Kevin E | $132,000 |
Source: Public Records
Tax History Compared to Growth
Tax History
| Year | Tax Paid | Tax Assessment Tax Assessment Total Assessment is a certain percentage of the fair market value that is determined by local assessors to be the total taxable value of land and additions on the property. | Land | Improvement |
|---|---|---|---|---|
| 2025 | $1,872 | $235,123 | $36,333 | $198,790 |
| 2024 | $1,872 | $173,793 | $27,902 | $145,891 |
| 2023 | $1,860 | $173,793 | $27,902 | $145,891 |
| 2022 | $1,610 | $144,582 | $25,365 | $119,217 |
| 2021 | $1,410 | $121,524 | $16,471 | $105,053 |
| 2020 | $1,305 | $113,203 | $14,974 | $98,229 |
| 2019 | $1,112 | $96,747 | $14,974 | $81,773 |
| 2018 | $1,063 | $94,651 | $14,974 | $79,677 |
| 2017 | $1,014 | $85,804 | $14,974 | $70,830 |
| 2016 | $862 | $76,262 | $14,974 | $61,288 |
| 2015 | $862 | $76,262 | $14,974 | $61,288 |
| 2014 | -- | $76,262 | $14,974 | $61,288 |
| 2013 | -- | $76,262 | $14,974 | $61,288 |
Source: Public Records
Map
Nearby Homes
- 165 N 100 W
- 75 N 100 West St
- 225 W 200 St N
- 295 N 100 West St
- 390 N 100 W
- 380 N 200 St W
- 40 S 100 Rd E
- 120 S 100 East Rd
- 335 W 400 North St
- 220 S 200 E
- 190 W 400 St S
- 310 S 500 West Rd
- 410 W 400 N
- 430 E Canyon Rd
- 155 E 500 St S
- 157 E 500 South St
- 405 E 500 St S
- 310 S 600 E
- 690 E 500 S
- 760 E 700 St S