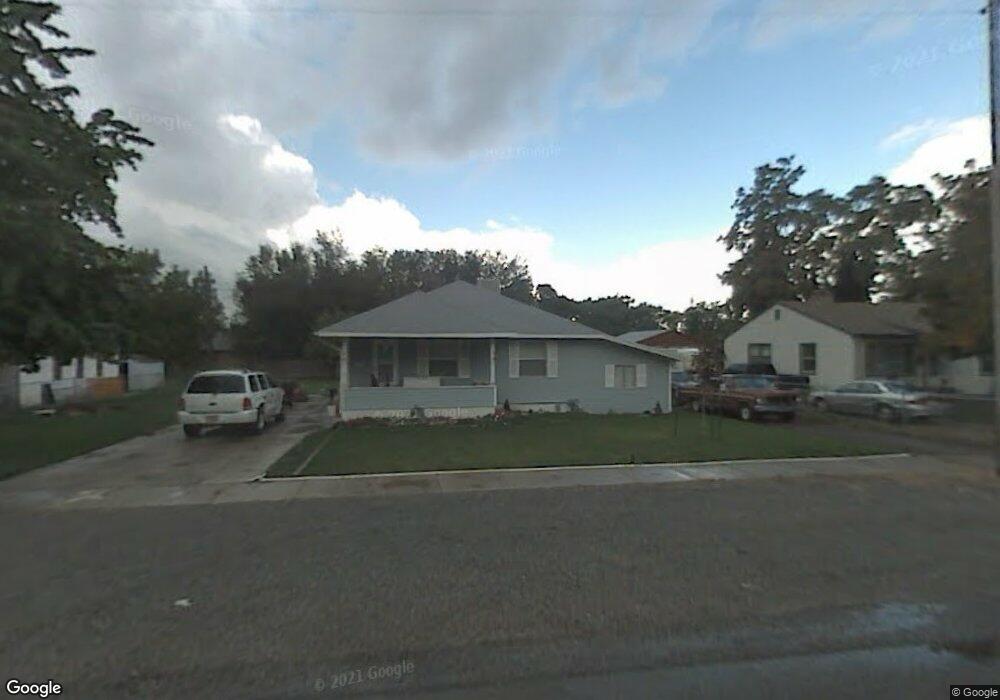
135 N 100 W Springville, UT 84663
Estimated Value: $390,000 - $460,000
3
Beds
1
Bath
2,016
Sq Ft
$212/Sq Ft
Est. Value
About This Home
This home is located at 135 N 100 W, Springville, UT 84663 and is currently estimated at $427,143, approximately $211 per square foot. 135 N 100 W is a home located in Utah County with nearby schools including Westside Elementary School, Springville Junior High School, and Springville High School.
Ownership History
Date
Name
Owned For
Owner Type
Purchase Details
Closed on
Jun 21, 2005
Sold by
Riches Casey D and Riches Mandi S
Bought by
Riches Casey D and Riches Mandi S
Current Estimated Value
Purchase Details
Closed on
Apr 11, 2005
Sold by
Gilbert Mikeal B and Gilbert Melanie K
Bought by
Riches Casey D and Riches Mandy S
Home Financials for this Owner
Home Financials are based on the most recent Mortgage that was taken out on this home.
Original Mortgage
$116,176
Outstanding Balance
$60,185
Interest Rate
5.84%
Mortgage Type
FHA
Estimated Equity
$366,958
Purchase Details
Closed on
Feb 28, 1997
Sold by
Lambourne Harold and Lambourne Cindy
Bought by
Gilbert Mikeal B and Gilbert Melanie K
Home Financials for this Owner
Home Financials are based on the most recent Mortgage that was taken out on this home.
Original Mortgage
$107,293
Interest Rate
7.86%
Mortgage Type
FHA
Create a Home Valuation Report for This Property
The Home Valuation Report is an in-depth analysis detailing your home's value as well as a comparison with similar homes in the area
Home Values in the Area
Average Home Value in this Area
Purchase History
| Date | Buyer | Sale Price | Title Company |
|---|---|---|---|
| Riches Casey D | -- | Sundance Title Insurance Ag | |
| Riches Casey D | -- | Inwest Title Services Inc | |
| Gilbert Mikeal B | -- | -- |
Source: Public Records
Mortgage History
| Date | Status | Borrower | Loan Amount |
|---|---|---|---|
| Open | Riches Casey D | $116,176 | |
| Previous Owner | Gilbert Mikeal B | $107,293 |
Source: Public Records
Tax History Compared to Growth
Tax History
| Year | Tax Paid | Tax Assessment Tax Assessment Total Assessment is a certain percentage of the fair market value that is determined by local assessors to be the total taxable value of land and additions on the property. | Land | Improvement |
|---|---|---|---|---|
| 2025 | $1,680 | $342,600 | $132,100 | $210,500 |
| 2024 | $1,680 | $172,095 | $0 | $0 |
| 2023 | $1,621 | $166,265 | $0 | $0 |
| 2022 | $1,766 | $177,870 | $0 | $0 |
| 2021 | $1,587 | $248,800 | $98,800 | $150,000 |
| 2020 | $1,453 | $220,800 | $82,300 | $138,500 |
| 2019 | $1,285 | $198,800 | $78,400 | $120,400 |
| 2018 | $1,295 | $191,200 | $70,800 | $120,400 |
| 2017 | $1,188 | $93,170 | $0 | $0 |
| 2016 | $980 | $75,350 | $0 | $0 |
| 2015 | $959 | $75,350 | $0 | $0 |
| 2014 | $965 | $75,350 | $0 | $0 |
Source: Public Records
Map
Nearby Homes