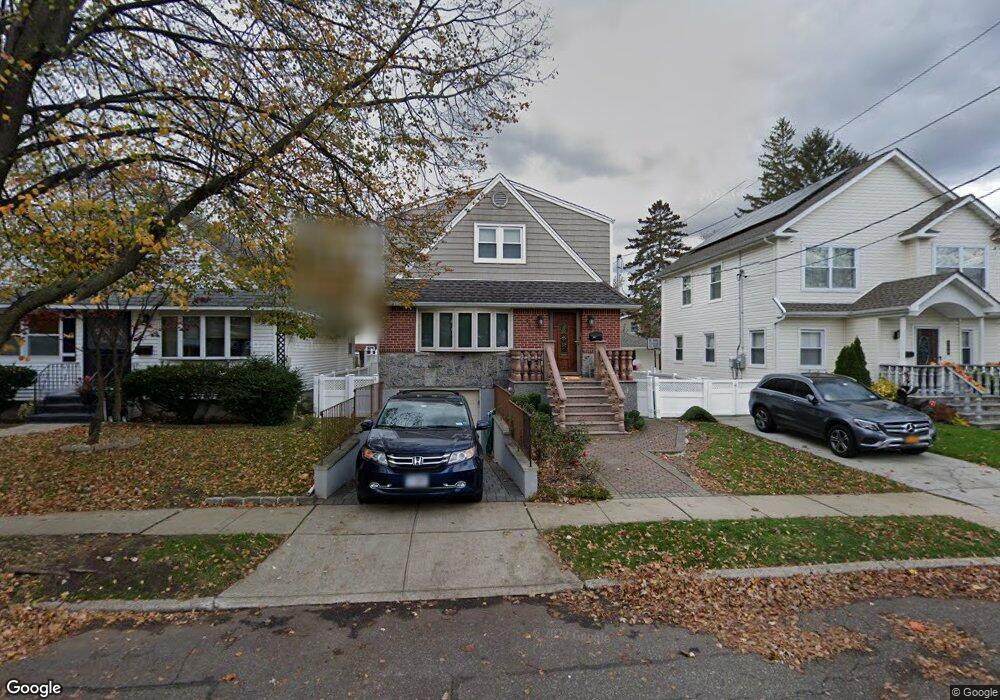
135 N 7th St New Hyde Park, NY 11040
Estimated Value: $1,054,670 - $1,141,000
6
Beds
3
Baths
2,208
Sq Ft
$497/Sq Ft
Est. Value
About This Home
This home is located at 135 N 7th St, New Hyde Park, NY 11040 and is currently estimated at $1,097,835, approximately $497 per square foot. 135 N 7th St is a home located in Nassau County with nearby schools including Notre Dame School.
Ownership History
Date
Name
Owned For
Owner Type
Purchase Details
Closed on
May 31, 2011
Sold by
Muthalakuzhiyil George and Ayyappan Janardanan
Bought by
Al-Karim Mamun and Rahman Bardunnessa
Current Estimated Value
Home Financials for this Owner
Home Financials are based on the most recent Mortgage that was taken out on this home.
Original Mortgage
$11,019
Outstanding Balance
$7,498
Interest Rate
4.74%
Mortgage Type
Purchase Money Mortgage
Estimated Equity
$1,090,337
Purchase Details
Closed on
Apr 15, 2010
Sold by
George Muthalkuzhiyil and Ayyappan Janardanan
Bought by
Al-Karim Mamun and Rahman Badrunnessa
Home Financials for this Owner
Home Financials are based on the most recent Mortgage that was taken out on this home.
Original Mortgage
$400,800
Interest Rate
4.99%
Mortgage Type
Purchase Money Mortgage
Purchase Details
Closed on
Oct 22, 2009
Sold by
Shirian Manoochehr
Bought by
Muthalakuzhiyil George and Ayyappan Janardanan
Purchase Details
Closed on
Oct 8, 2008
Sold by
Shirian Mahvash and Shirian Manoochehr
Bought by
Shirian Manoochehr
Create a Home Valuation Report for This Property
The Home Valuation Report is an in-depth analysis detailing your home's value as well as a comparison with similar homes in the area
Home Values in the Area
Average Home Value in this Area
Purchase History
| Date | Buyer | Sale Price | Title Company |
|---|---|---|---|
| Al-Karim Mamun | -- | -- | |
| Al-Karim Mamun | $501,000 | -- | |
| Muthalakuzhiyil George | $356,000 | -- | |
| Shirian Manoochehr | -- | None Available |
Source: Public Records
Mortgage History
| Date | Status | Borrower | Loan Amount |
|---|---|---|---|
| Open | Al-Karim Mamun | $11,019 | |
| Previous Owner | Al-Karim Mamun | $400,800 |
Source: Public Records
Tax History
| Year | Tax Paid | Tax Assessment Tax Assessment Total Assessment is a certain percentage of the fair market value that is determined by local assessors to be the total taxable value of land and additions on the property. | Land | Improvement |
|---|---|---|---|---|
| 2025 | $15,355 | $748 | $300 | $448 |
| 2024 | $3,850 | $748 | $300 | $448 |
| 2023 | $14,186 | $748 | $300 | $448 |
| 2022 | $14,186 | $748 | $300 | $448 |
| 2021 | $12,882 | $735 | $295 | $440 |
| 2020 | $12,740 | $952 | $633 | $319 |
| 2019 | $11,590 | $952 | $633 | $319 |
| 2018 | $10,790 | $952 | $0 | $0 |
| 2017 | $6,845 | $952 | $633 | $319 |
| 2016 | $9,567 | $952 | $601 | $351 |
| 2015 | $2,590 | $952 | $547 | $405 |
| 2014 | $2,590 | $952 | $547 | $405 |
| 2013 | $2,593 | $1,002 | $576 | $426 |
Source: Public Records
Map
Nearby Homes
Your Personal Tour Guide
Ask me questions while you tour the home.