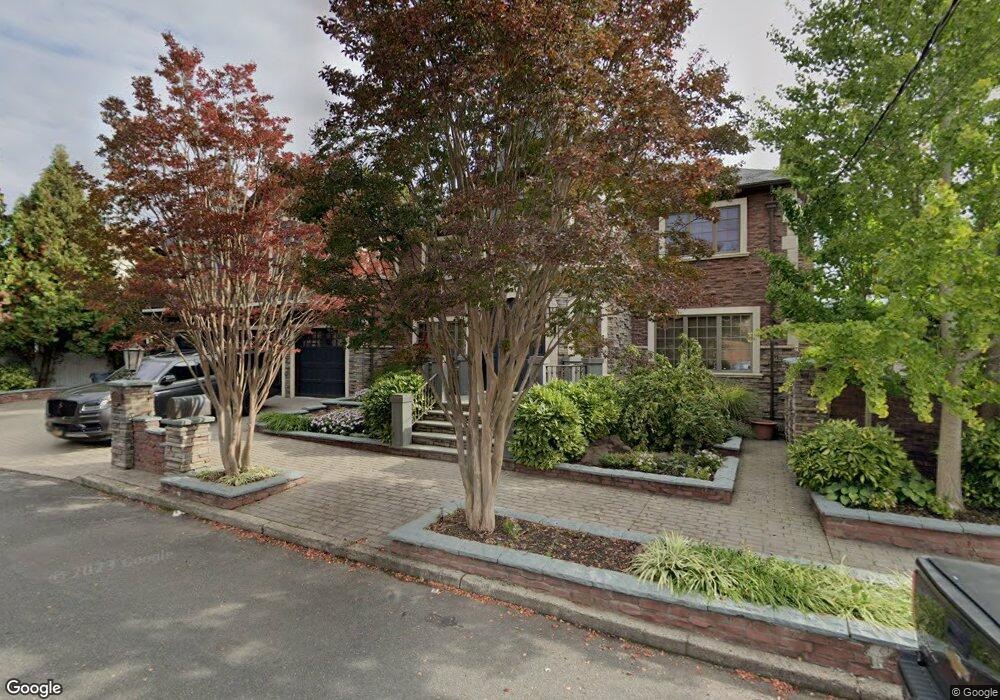
135 Nancy Ln Staten Island, NY 10307
Tottenville NeighborhoodEstimated Value: $1,464,184 - $1,831,000
5
Beds
3
Baths
4,320
Sq Ft
$370/Sq Ft
Est. Value
About This Home
This home is located at 135 Nancy Ln, Staten Island, NY 10307 and is currently estimated at $1,598,296, approximately $369 per square foot. 135 Nancy Ln is a home located in Richmond County with nearby schools including P.S. 6 Cpl Allan F Kivlehan School, Is 34 Tottenville, and Tottenville High School.
Ownership History
Date
Name
Owned For
Owner Type
Purchase Details
Closed on
Nov 11, 2004
Sold by
Dutton Ronald B and Dutton Denise S
Bought by
Dutton Denise B
Current Estimated Value
Purchase Details
Closed on
Jul 18, 2001
Sold by
Paino John and Paino Vita
Bought by
Dutton Ronald B and Dutton Denise S
Home Financials for this Owner
Home Financials are based on the most recent Mortgage that was taken out on this home.
Original Mortgage
$400,000
Outstanding Balance
$149,775
Interest Rate
6.75%
Estimated Equity
$1,448,521
Create a Home Valuation Report for This Property
The Home Valuation Report is an in-depth analysis detailing your home's value as well as a comparison with similar homes in the area
Home Values in the Area
Average Home Value in this Area
Purchase History
| Date | Buyer | Sale Price | Title Company |
|---|---|---|---|
| Dutton Denise B | -- | Jpmorgan Title Agency | |
| Dutton Ronald B | $595,000 | -- |
Source: Public Records
Mortgage History
| Date | Status | Borrower | Loan Amount |
|---|---|---|---|
| Open | Dutton Ronald B | $400,000 |
Source: Public Records
Tax History Compared to Growth
Tax History
| Year | Tax Paid | Tax Assessment Tax Assessment Total Assessment is a certain percentage of the fair market value that is determined by local assessors to be the total taxable value of land and additions on the property. | Land | Improvement |
|---|---|---|---|---|
| 2025 | $14,368 | $80,340 | $24,839 | $55,501 |
| 2024 | $14,380 | $77,820 | $25,643 | $52,177 |
| 2023 | $13,753 | $69,120 | $24,152 | $44,968 |
| 2022 | $13,346 | $76,740 | $27,360 | $49,380 |
| 2021 | $13,256 | $70,440 | $27,360 | $43,080 |
| 2020 | $12,569 | $60,780 | $27,360 | $33,420 |
| 2019 | $12,479 | $64,560 | $27,360 | $37,200 |
| 2018 | $11,444 | $57,600 | $27,360 | $30,240 |
| 2017 | $12,421 | $62,400 | $27,360 | $35,040 |
| 2016 | $11,661 | $59,880 | $27,360 | $32,520 |
| 2015 | $11,014 | $59,976 | $22,257 | $37,719 |
| 2014 | $11,014 | $58,980 | $22,800 | $36,180 |
Source: Public Records
Map
Nearby Homes