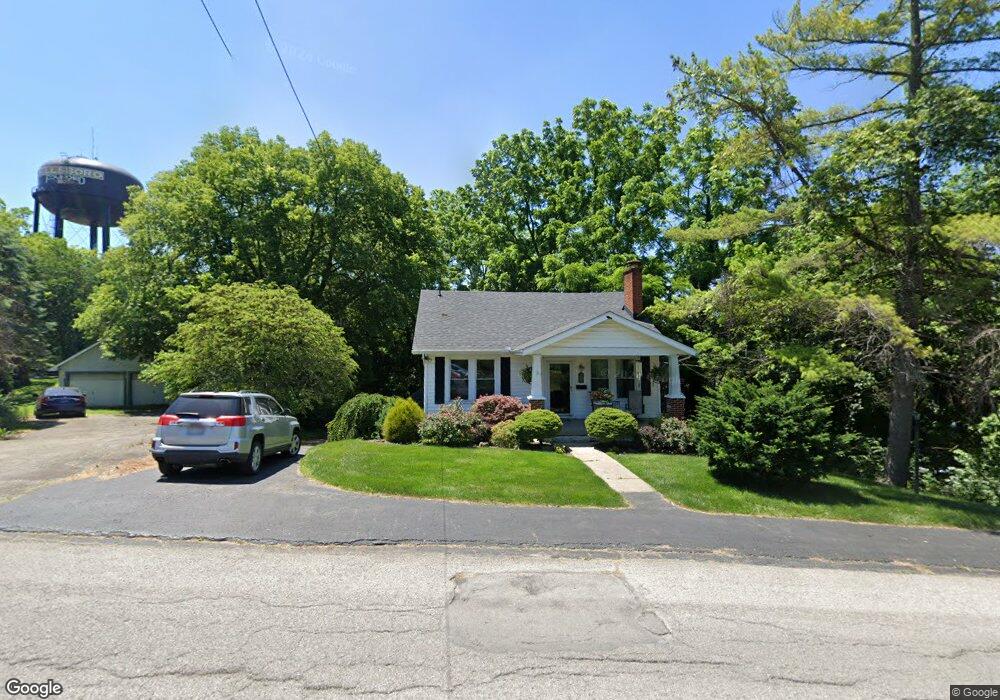
135 Oak St Hillsboro, OH 45133
Estimated Value: $146,712 - $202,000
3
Beds
1
Bath
1,051
Sq Ft
$160/Sq Ft
Est. Value
About This Home
This home is located at 135 Oak St, Hillsboro, OH 45133 and is currently estimated at $168,178, approximately $160 per square foot. 135 Oak St is a home located in Highland County with nearby schools including Hillsboro Primary School, Hillsboro Middle School, and Hillsboro High School.
Ownership History
Date
Name
Owned For
Owner Type
Purchase Details
Closed on
Sep 30, 2016
Sold by
Bridgette M Burnett
Bought by
Kosegi Cathy and Kosegi James
Current Estimated Value
Home Financials for this Owner
Home Financials are based on the most recent Mortgage that was taken out on this home.
Original Mortgage
$81,700
Outstanding Balance
$65,415
Interest Rate
3.42%
Estimated Equity
$102,763
Purchase Details
Closed on
Sep 23, 1998
Sold by
Robert Kay Properties Ll
Bought by
Neel Tony Perez Michelle C
Home Financials for this Owner
Home Financials are based on the most recent Mortgage that was taken out on this home.
Original Mortgage
$57,150
Interest Rate
10.5%
Mortgage Type
New Conventional
Purchase Details
Closed on
Aug 13, 1997
Sold by
Hamilton Paul
Bought by
Robert Kay Properties
Purchase Details
Closed on
Jan 1, 1990
Bought by
Hamilton Paul and Hamilton Cecilia
Create a Home Valuation Report for This Property
The Home Valuation Report is an in-depth analysis detailing your home's value as well as a comparison with similar homes in the area
Home Values in the Area
Average Home Value in this Area
Purchase History
| Date | Buyer | Sale Price | Title Company |
|---|---|---|---|
| Kosegi Cathy | -- | -- | |
| Neel Tony Perez Michelle C | $63,500 | -- | |
| Robert Kay Properties | $54,000 | -- | |
| Hamilton Paul | -- | -- |
Source: Public Records
Mortgage History
| Date | Status | Borrower | Loan Amount |
|---|---|---|---|
| Open | Kosegi Cathy | $81,700 | |
| Closed | Kosegi Cathy | -- | |
| Previous Owner | Neel Tony Perez Michelle C | $57,150 |
Source: Public Records
Tax History Compared to Growth
Tax History
| Year | Tax Paid | Tax Assessment Tax Assessment Total Assessment is a certain percentage of the fair market value that is determined by local assessors to be the total taxable value of land and additions on the property. | Land | Improvement |
|---|---|---|---|---|
| 2024 | $1,333 | $38,860 | $15,440 | $23,420 |
| 2023 | $1,333 | $30,140 | $13,480 | $16,660 |
| 2022 | $1,138 | $30,140 | $13,480 | $16,660 |
| 2021 | $1,087 | $30,140 | $13,480 | $16,660 |
| 2020 | $828 | $25,140 | $11,240 | $13,900 |
| 2019 | $806 | $25,140 | $11,240 | $13,900 |
| 2018 | $798 | $25,140 | $11,240 | $13,900 |
| 2017 | $796 | $24,960 | $11,240 | $13,720 |
| 2016 | $799 | $24,960 | $11,240 | $13,720 |
| 2015 | $834 | $24,960 | $11,240 | $13,720 |
| 2014 | $872 | $24,960 | $11,240 | $13,720 |
| 2013 | $874 | $24,960 | $11,240 | $13,720 |
Source: Public Records
Map
Nearby Homes
- 0 US 50 Unit 1857481
- 147 W Main St
- 316 W South St
- 129 Lanewood Dr
- 826 W Main St
- 227 W South St
- 63 Willettsville Pike
- 331 S West St
- 103 W Josie Ave
- 337 N West St
- 515 S Elm St
- 0 U S Highway 62
- 701 S Elm St
- 338 S High St
- 222 John St
- 702 Cheryl Ln
- 508 N West St
- 129 Vaughn Ave
- 129 E North St
- 336 N High St