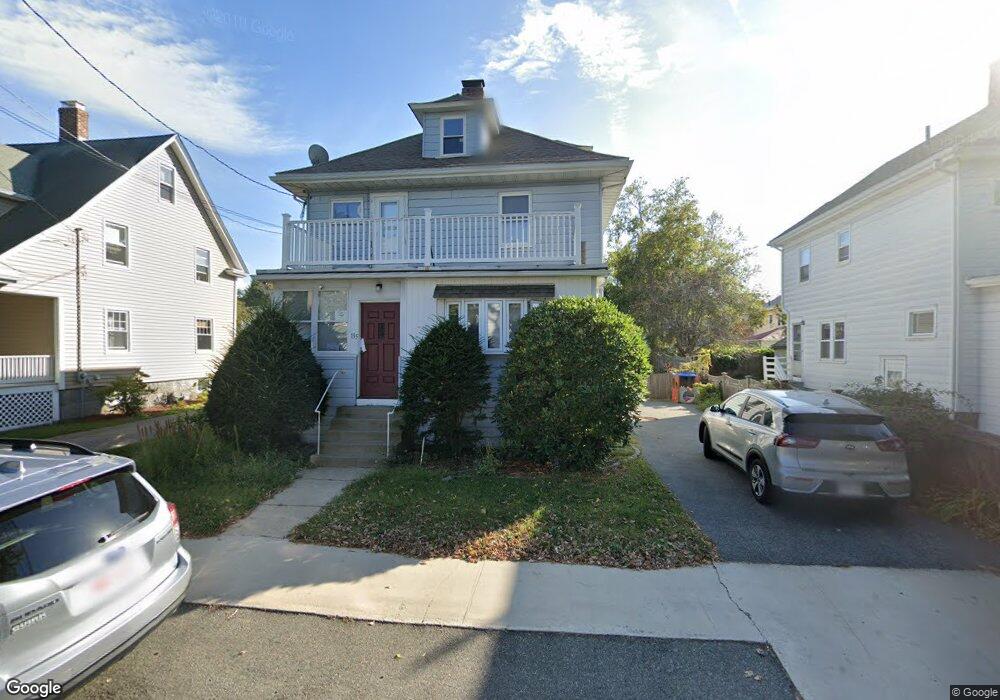
135 Phillips St Quincy, MA 02170
Wollaston NeighborhoodEstimated Value: $745,000 - $792,000
3
Beds
2
Baths
1,603
Sq Ft
$478/Sq Ft
Est. Value
About This Home
This home is located at 135 Phillips St, Quincy, MA 02170 and is currently estimated at $765,682, approximately $477 per square foot. 135 Phillips St is a home located in Norfolk County with nearby schools including Beechwood Knoll Elementary School, Central Middle School, and North Quincy High School.
Ownership History
Date
Name
Owned For
Owner Type
Purchase Details
Closed on
Nov 8, 2013
Sold by
Mullen John F and Glynn Donna J
Bought by
Glynn Donna J
Current Estimated Value
Purchase Details
Closed on
Jun 7, 2005
Sold by
Legrice Louise
Bought by
Glynn Donna and Glynn James
Home Financials for this Owner
Home Financials are based on the most recent Mortgage that was taken out on this home.
Original Mortgage
$60,000
Interest Rate
5.83%
Mortgage Type
Purchase Money Mortgage
Purchase Details
Closed on
Jun 2, 2005
Sold by
Glynn Donna M and Glynn James W
Bought by
Glynn Donna J and Mullen John F
Home Financials for this Owner
Home Financials are based on the most recent Mortgage that was taken out on this home.
Original Mortgage
$60,000
Interest Rate
5.83%
Mortgage Type
Purchase Money Mortgage
Create a Home Valuation Report for This Property
The Home Valuation Report is an in-depth analysis detailing your home's value as well as a comparison with similar homes in the area
Home Values in the Area
Average Home Value in this Area
Purchase History
| Date | Buyer | Sale Price | Title Company |
|---|---|---|---|
| Glynn Donna J | -- | -- | |
| Glynn Donna | $360,000 | -- | |
| Glynn Donna J | $400,000 | -- |
Source: Public Records
Mortgage History
| Date | Status | Borrower | Loan Amount |
|---|---|---|---|
| Previous Owner | Glynn Donna | $60,000 | |
| Previous Owner | Glynn Donna J | $320,000 |
Source: Public Records
Tax History Compared to Growth
Tax History
| Year | Tax Paid | Tax Assessment Tax Assessment Total Assessment is a certain percentage of the fair market value that is determined by local assessors to be the total taxable value of land and additions on the property. | Land | Improvement |
|---|---|---|---|---|
| 2025 | $7,582 | $657,600 | $338,500 | $319,100 |
| 2024 | $7,340 | $651,300 | $338,500 | $312,800 |
| 2023 | $6,829 | $613,600 | $322,400 | $291,200 |
| 2022 | $6,365 | $531,300 | $257,900 | $273,400 |
| 2021 | $6,327 | $521,200 | $257,900 | $263,300 |
| 2020 | $6,256 | $503,300 | $257,900 | $245,400 |
| 2019 | $5,963 | $475,100 | $241,000 | $234,100 |
| 2018 | $5,812 | $435,700 | $219,100 | $216,600 |
| 2017 | $5,889 | $415,600 | $219,100 | $196,500 |
| 2016 | $5,496 | $382,700 | $199,100 | $183,600 |
| 2015 | $5,106 | $349,700 | $181,100 | $168,600 |
| 2014 | $4,959 | $333,700 | $172,400 | $161,300 |
Source: Public Records
Map
Nearby Homes
- 72 Waterston Ave
- 123 Waterston Ave
- 14 Ridgeway St
- 22 Beach St
- 101 Beach St
- 100 Thornton St
- 35 Estabrook Rd
- 65 - 67 Davis St
- 163 Clay St Unit C
- 41 Randlett St
- 43 Ellington Rd
- 22 Newton Ave
- 55 Warren Ave
- 158 W Elm Ave
- 365 Newport Ave Unit 301
- 522 Hancock St
- 511 Hancock St Unit 207
- 21 Linden St Unit 417
- 111 Warren Ave Unit 1F
- 165 Old Colony Ave Unit A
- 139 Phillips St
- 131 Phillips St
- 127 Phillips St
- 136 Marlboro St
- 90 Waterston Ave
- 132 Marlboro St
- 143 Phillips St
- 140 Marlboro St
- 142 Marlboro St
- 128 Marlboro St
- 144 Marlboro St
- 136 Phillips St
- 123 Phillips St
- 130 Marlboro St
- 132 Phillips St
- 140 Phillips St
- 144 Phillips St
- 128 Phillips St
- 124 Marlboro St
- 117 Phillips St