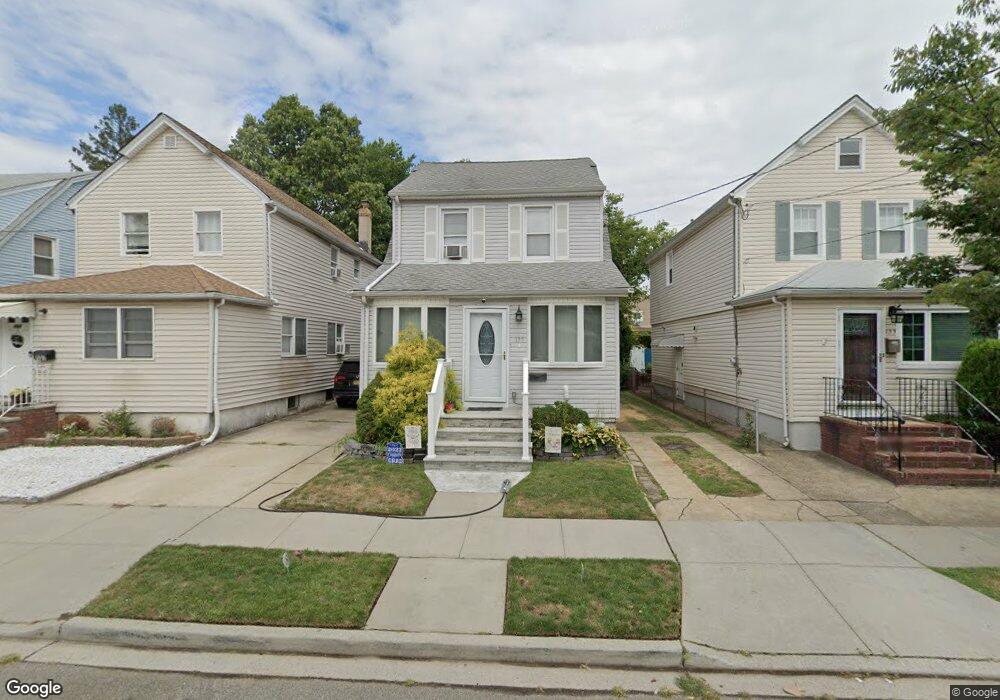
135 Pilgrim Place Valley Stream, NY 11580
Estimated Value: $650,640 - $700,000
3
Beds
1
Bath
1,296
Sq Ft
$521/Sq Ft
Est. Value
About This Home
This home is located at 135 Pilgrim Place, Valley Stream, NY 11580 and is currently estimated at $675,320, approximately $521 per square foot. 135 Pilgrim Place is a home located in Nassau County with nearby schools including Valley Stream Christian Academy and Martin De Porres High School.
Ownership History
Date
Name
Owned For
Owner Type
Purchase Details
Closed on
Mar 30, 2021
Sold by
Murray Keinon and Rousseau Urilka
Bought by
Rousseau Urilka
Current Estimated Value
Home Financials for this Owner
Home Financials are based on the most recent Mortgage that was taken out on this home.
Original Mortgage
$274,725
Outstanding Balance
$248,043
Interest Rate
3%
Mortgage Type
FHA
Estimated Equity
$427,277
Purchase Details
Closed on
Jul 24, 2009
Sold by
Hsbc Bank Usa Na
Bought by
Murray Keinon and Rousseau Urilka
Home Financials for this Owner
Home Financials are based on the most recent Mortgage that was taken out on this home.
Original Mortgage
$247,659
Interest Rate
5.47%
Mortgage Type
Purchase Money Mortgage
Purchase Details
Closed on
Sep 9, 2008
Sold by
Referee Of Nassau County
Bought by
Hsbc Bank Usa Na
Purchase Details
Closed on
Jan 20, 2006
Sold by
Barker Clifford
Create a Home Valuation Report for This Property
The Home Valuation Report is an in-depth analysis detailing your home's value as well as a comparison with similar homes in the area
Home Values in the Area
Average Home Value in this Area
Purchase History
| Date | Buyer | Sale Price | Title Company |
|---|---|---|---|
| Rousseau Urilka | -- | None Available | |
| Murray Keinon | $252,247 | -- | |
| Hsbc Bank Usa Na | $379,442 | None Available | |
| -- | -- | -- |
Source: Public Records
Mortgage History
| Date | Status | Borrower | Loan Amount |
|---|---|---|---|
| Open | Rousseau Urilka | $274,725 | |
| Previous Owner | Murray Keinon | $247,659 | |
| Closed | Hsbc Bank Usa Na | $0 |
Source: Public Records
Tax History
| Year | Tax Paid | Tax Assessment Tax Assessment Total Assessment is a certain percentage of the fair market value that is determined by local assessors to be the total taxable value of land and additions on the property. | Land | Improvement |
|---|---|---|---|---|
| 2025 | $8,014 | $423 | $146 | $277 |
| 2024 | $1,722 | $423 | $146 | $277 |
| 2023 | $7,942 | $423 | $146 | $277 |
| 2022 | $7,942 | $423 | $146 | $277 |
| 2021 | $11,520 | $405 | $140 | $265 |
| 2020 | $8,406 | $700 | $414 | $286 |
| 2019 | $1,713 | $687 | $414 | $273 |
| 2018 | $1,639 | $687 | $0 | $0 |
| 2017 | $5,428 | $687 | $414 | $273 |
| 2016 | $6,997 | $687 | $414 | $273 |
| 2015 | $1,539 | $687 | $414 | $273 |
| 2014 | $1,539 | $687 | $414 | $273 |
| 2013 | $1,432 | $687 | $414 | $273 |
Source: Public Records
Map
Nearby Homes
- 73 Hamilton Ave
- 64 S Montgomery St
- 76 S Montgomery St
- 114 Camdike St
- 46 Benedict Ave
- 7 Stein St
- 132 S Terrace Place
- 17 Sapir St
- 16 Felton Ave
- 160 N Central Ave
- 36 Hudson Ave
- 181 Martens Ave
- 34 Meyer Ave
- 6 Birch Ln
- 125 Boden Ave
- 11 Edwards Place
- 85 Todd Rd
- 83 W Valley Stream Blvd
- 135 Casper St
- 27 Birch Ln
- 133 Pilgrim Place
- 137 Pilgrim Place
- 137 Pilgrim Place Unit 1
- 131 Pilgrim Place
- 131 Pilgrim Place Unit 2nd Fl
- 139 Pilgrim Place
- 129 Pilgrim Place Unit 1
- 129 Pilgrim Place
- 141 Pilgrim Place
- 136 Buscher Ave
- 132 Buscher Ave
- 138 Buscher Ave
- 134 Buscher Ave
- 127 Pilgrim Place
- 130 Buscher Ave
- 143 Pilgrim Place
- 140 Buscher Ave
- 128 Buscher Ave
- 125 Pilgrim Place
- 138 Pilgrim Place
Your Personal Tour Guide
Ask me questions while you tour the home.