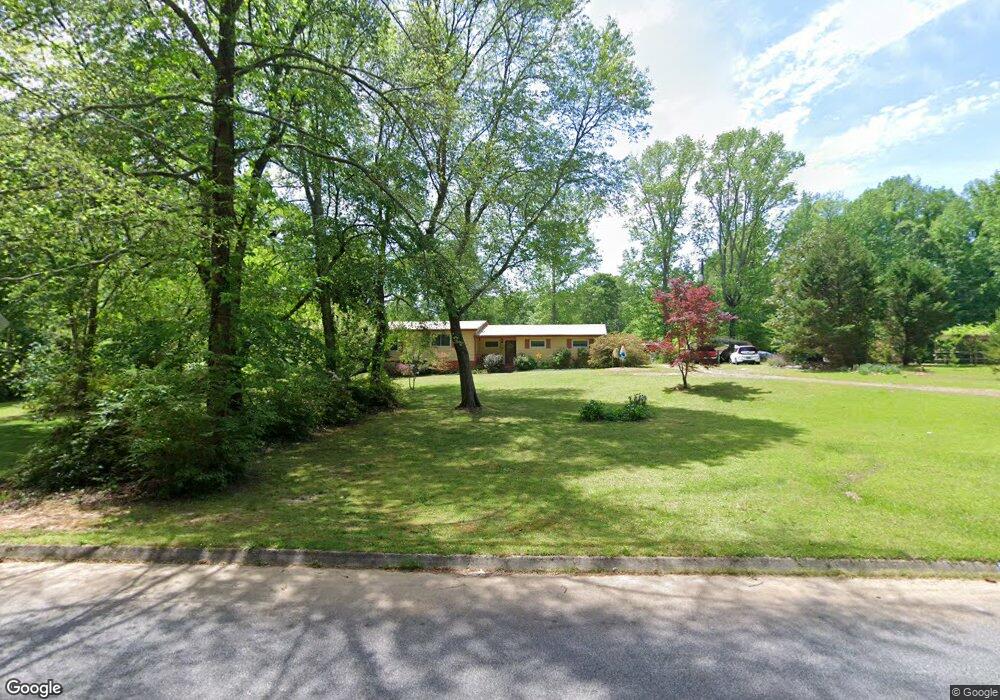
135 Pirkle Rd Griffin, GA 30223
Spalding County NeighborhoodEstimated Value: $175,428 - $201,000
2
Beds
2
Baths
1,560
Sq Ft
$122/Sq Ft
Est. Value
About This Home
This home is located at 135 Pirkle Rd, Griffin, GA 30223 and is currently estimated at $190,357, approximately $122 per square foot. 135 Pirkle Rd is a home located in Spalding County with nearby schools including Orrs Elementary School, Carver Road Middle School, and Griffin High School.
Ownership History
Date
Name
Owned For
Owner Type
Purchase Details
Closed on
Nov 30, 2000
Sold by
Jester Shirley A
Bought by
Texidor Hilton
Current Estimated Value
Home Financials for this Owner
Home Financials are based on the most recent Mortgage that was taken out on this home.
Original Mortgage
$66,452
Outstanding Balance
$24,700
Interest Rate
7.82%
Mortgage Type
FHA
Estimated Equity
$165,657
Purchase Details
Closed on
Apr 25, 1988
Sold by
Stonica Joseph J and Stonica Grace C
Bought by
Jester Wilmer K and Jester Shirley A
Purchase Details
Closed on
Apr 14, 1986
Sold by
Banks Fred L and Banks Bonnie M
Bought by
Stonica Joseph J and Stonica Grace C
Purchase Details
Closed on
Dec 13, 1971
Sold by
Murray George N
Bought by
Banks Fred L and Banks Bonnie M
Purchase Details
Closed on
Nov 12, 1971
Sold by
Williamson J D
Bought by
Murray George N
Purchase Details
Closed on
May 5, 1970
Sold by
Williamson Guy A and Williamson Joe D
Bought by
Williamson J D
Purchase Details
Closed on
Feb 6, 1970
Bought by
Williamson Guy A and Williamson Joe D
Create a Home Valuation Report for This Property
The Home Valuation Report is an in-depth analysis detailing your home's value as well as a comparison with similar homes in the area
Home Values in the Area
Average Home Value in this Area
Purchase History
| Date | Buyer | Sale Price | Title Company |
|---|---|---|---|
| Texidor Hilton | $67,000 | -- | |
| Jester Wilmer K | $54,000 | -- | |
| Stonica Joseph J | $50,000 | -- | |
| Banks Fred L | $8,000 | -- | |
| Murray George N | $7,200 | -- | |
| Williamson J D | -- | -- | |
| Williamson Guy A | -- | -- |
Source: Public Records
Mortgage History
| Date | Status | Borrower | Loan Amount |
|---|---|---|---|
| Open | Texidor Hilton | $66,452 |
Source: Public Records
Tax History Compared to Growth
Tax History
| Year | Tax Paid | Tax Assessment Tax Assessment Total Assessment is a certain percentage of the fair market value that is determined by local assessors to be the total taxable value of land and additions on the property. | Land | Improvement |
|---|---|---|---|---|
| 2024 | $1,346 | $39,432 | $12,324 | $27,108 |
| 2023 | $1,346 | $39,432 | $12,324 | $27,108 |
| 2022 | $1,208 | $35,029 | $10,681 | $24,348 |
| 2021 | $1,146 | $33,324 | $10,681 | $22,643 |
| 2020 | $1,150 | $33,324 | $10,681 | $22,643 |
| 2019 | $1,173 | $33,324 | $10,681 | $22,643 |
| 2018 | $1,127 | $31,308 | $10,681 | $20,627 |
| 2017 | $1,097 | $31,308 | $10,681 | $20,627 |
| 2016 | $1,116 | $31,308 | $10,681 | $20,627 |
| 2015 | $1,151 | $31,308 | $10,681 | $20,627 |
| 2014 | $1,173 | $31,308 | $10,681 | $20,627 |
Source: Public Records
Map
Nearby Homes
- 2637 Birdie Rd
- 4251 Fayetteville Rd
- 1317 Cheatham Rd
- 3701 Fayetteville Rd
- 171 Davidson Dr
- 394 Sidney Dr
- 580 Hardy Ln
- 1019 Oakridge Dr
- 164 David Elder Rd
- 0 Deason St Unit 23730
- 0 Deason St Unit 10624935
- 697 Steele Rd
- 1100 Stiles Crossing
- 1102 Stiles Crossing
- 1972 Pinecrest Dr Unit 4
- 1949 Bonnie Ridge Dr
- 265 Steele Rd
- 505 New Salem Rd
- 475 Edwards Rd
- 1115 Burgundy Dr
- 102 Pirkle Rd
- 0 Pirkle Rd
- 178 Pirkle Rd
- 175 Pirkle Rd
- 182 Pirkle Rd
- 4034 Fayetteville Rd
- 100 Pirkle Rd
- 77 Pirkle Rd
- 4037 Fayetteville Rd
- 4008 Fayetteville Rd
- 4130 Fayetteville Rd
- 4030 Fayetteville Rd Unit 81
- 4030 Fayetteville Rd
- 4030 Fayetteville Rd
- 4028 Fayetteville Rd
- 4140 Fayetteville Rd
- 4150 Fayetteville Rd
- 32 Pirkle Rd
- 3973 Fayetteville Rd
- 4128 Fayetteville Rd