135 Piscataqua Rd Durham, NH 03824
Estimated Value: $1,422,000 - $2,000,763
About This Home
This home is located at 135 Piscataqua Rd, Durham, NH 03824 and is currently estimated at $1,711,382, approximately $373 per square foot. 135 Piscataqua Rd is a home located in Strafford County with nearby schools including Mast Way School, Oyster River Middle School, and Oyster River High School.
Ownership History
We collect this data history from publicly available records. To have your information removed, we recommend requesting removal directly through your county’s website.
Purchase Details
Home Values in the Area
Average Home Value in this Area
Purchase History
We collect this data history from publicly available records. To have your information removed, we recommend requesting removal directly through your county’s website.
| Date | Buyer | Sale Price | Title Company |
|---|---|---|---|
| -- | -- |
Mortgage History
We collect this data history from publicly available records. To have your information removed, we recommend requesting removal directly through your county’s website.
| Date | Status | Borrower | Loan Amount |
|---|---|---|---|
| Open | $500,000 | ||
| Closed | $300,000 |
Tax History
We collect this data history from publicly available records. To have your information removed, we recommend requesting removal directly through your county’s website.
| Year | Tax Paid | Tax Assessment Tax Assessment Total Assessment is a certain percentage of the fair market value that is determined by local assessors to be the total taxable value of land and additions on the property. | Land | Improvement |
|---|---|---|---|---|
| 2025 | $37,625 | $1,993,901 | $247,501 | $1,746,400 |
| 2024 | $35,475 | $1,744,963 | $173,763 | $1,571,200 |
| 2023 | $35,738 | $1,745,010 | $173,810 | $1,571,200 |
| 2022 | $31,912 | $1,098,887 | $114,187 | $984,700 |
| 2021 | $29,316 | $1,050,359 | $114,359 | $936,000 |
| 2020 | $29,126 | $1,050,359 | $114,359 | $936,000 |
| 2019 | $27,057 | $986,392 | $114,392 | $872,000 |
| 2018 | $26,436 | $986,410 | $114,410 | $872,000 |
| 2017 | $27,816 | $907,848 | $78,648 | $829,200 |
| 2016 | $26,991 | $907,874 | $78,674 | $829,200 |
| 2015 | $27,101 | $907,893 | $78,693 | $829,200 |
| 2014 | $27,709 | $907,893 | $78,693 | $829,200 |
| 2013 | $23,115 | $760,110 | $78,710 | $681,400 |
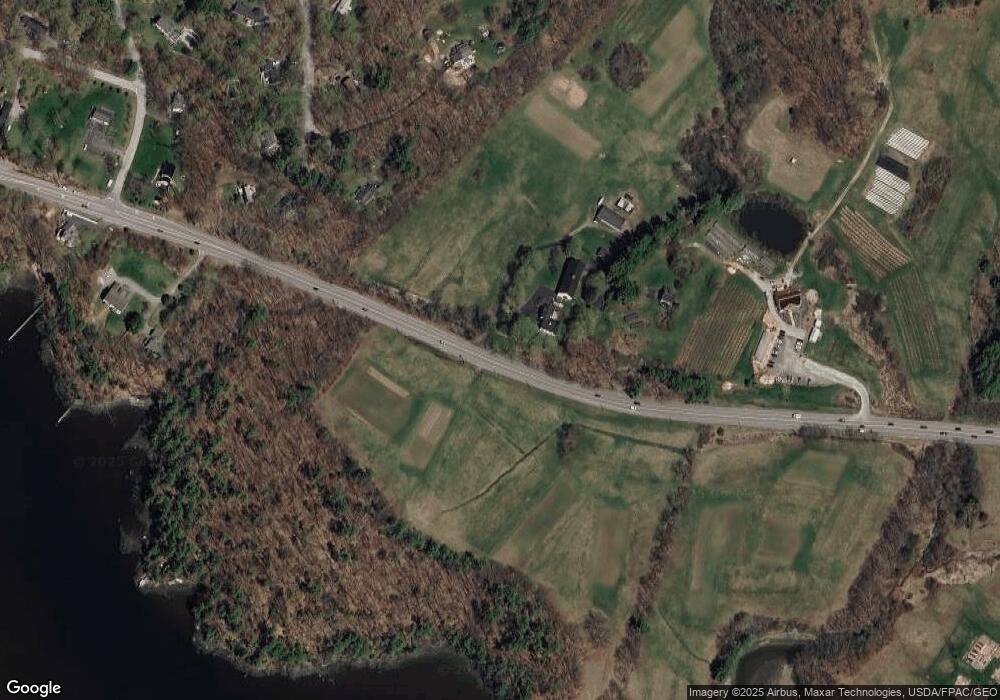
Map
- 1 Riverview Ct
- 75 Piscataqua Rd
- 50 Piscataqua Rd
- 8 Willey Creek Rd
- 28 Colony Cove Rd
- 18 Piscataqua Rd
- 267 Durham Point Rd
- 18 Deborah Ln
- 18 Deborah Ln Unit 18
- 24 Deborah Ln
- 1 Denbow Rd
- 177 Spur Rd
- 2 Blue Heron Dr
- 131 Spur Rd
- 51 Sandy Brook Dr
- 8 Old Landing Rd
- 10 Young Dr
- 9 Young Dr
- 6 Roberta Dr
- 25 Nute Rd
- 7 Tirrell Place
- 5 Tirrell Place
- 9 Tirrell Place
- 3 Tirrell Place
- 8 Tirrell Place
- 6 Tirrell Place
- 1 Tirrell Place
- 4 Tirrell Place
- 12 Morgan Way
- 15 Morgan Way
- 118 Piscataqua Rd
- 2 Morgan Way
- 116 Piscataqua Rd Unit B
- 116 Piscataqua Rd Unit A
- 116 Piscataqua Rd Unit 3
- 116 Piscataqua Rd
- 116 Piscataqua Rd Unit 116 D
- 116 Piscataqua Rd Unit 4
- 6 Morgan Way
- 13 Morgan Way
Ask me questions while you tour the home.