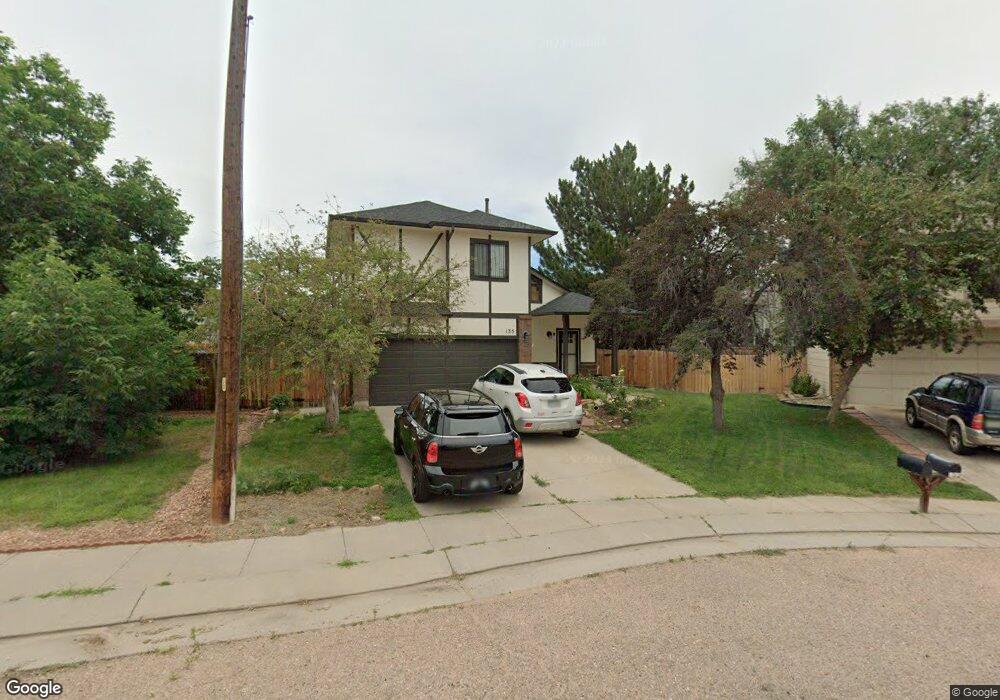
135 Pointer Place Colorado Springs, CO 80911
Fountain Valley Ranch NeighborhoodEstimated Value: $370,313 - $398,000
5
Beds
4
Baths
1,262
Sq Ft
$305/Sq Ft
Est. Value
About This Home
This home is located at 135 Pointer Place, Colorado Springs, CO 80911 and is currently estimated at $385,328, approximately $305 per square foot. 135 Pointer Place is a home located in El Paso County with nearby schools including Venetucci Elementary School, Watson Junior High School, and Widefield High School.
Ownership History
Date
Name
Owned For
Owner Type
Purchase Details
Closed on
May 31, 2016
Sold by
Cox Joel D
Bought by
Cox Joel D and Cox Jamie
Current Estimated Value
Purchase Details
Closed on
Jul 25, 2002
Sold by
Seymour Robert A
Bought by
Cox Joel D
Home Financials for this Owner
Home Financials are based on the most recent Mortgage that was taken out on this home.
Original Mortgage
$133,168
Outstanding Balance
$55,549
Interest Rate
6.62%
Mortgage Type
FHA
Estimated Equity
$329,779
Purchase Details
Closed on
Jul 1, 1993
Bought by
Cox Joel D
Purchase Details
Closed on
Sep 28, 1989
Bought by
Cox Joel D
Purchase Details
Closed on
Sep 1, 1988
Bought by
Cox Jamie
Purchase Details
Closed on
Oct 1, 1986
Bought by
Cox Joel D
Create a Home Valuation Report for This Property
The Home Valuation Report is an in-depth analysis detailing your home's value as well as a comparison with similar homes in the area
Home Values in the Area
Average Home Value in this Area
Purchase History
| Date | Buyer | Sale Price | Title Company |
|---|---|---|---|
| Cox Joel D | -- | Empire Title Of Colorado Spr | |
| Cox Joel D | $139,000 | Security Title | |
| Cox Joel D | $81,500 | -- | |
| Cox Joel D | $64,000 | -- | |
| Cox Jamie | -- | -- | |
| Cox Joel D | -- | -- |
Source: Public Records
Mortgage History
| Date | Status | Borrower | Loan Amount |
|---|---|---|---|
| Open | Cox Joel D | $133,168 |
Source: Public Records
Tax History Compared to Growth
Tax History
| Year | Tax Paid | Tax Assessment Tax Assessment Total Assessment is a certain percentage of the fair market value that is determined by local assessors to be the total taxable value of land and additions on the property. | Land | Improvement |
|---|---|---|---|---|
| 2025 | $1,809 | $27,620 | -- | -- |
| 2024 | $1,755 | $28,030 | $4,820 | $23,210 |
| 2023 | $1,755 | $28,030 | $4,820 | $23,210 |
| 2022 | $1,475 | $19,760 | $3,340 | $16,420 |
| 2021 | $1,591 | $20,330 | $3,430 | $16,900 |
| 2020 | $1,387 | $17,220 | $3,000 | $14,220 |
| 2019 | $1,379 | $17,220 | $3,000 | $14,220 |
| 2018 | $1,068 | $12,440 | $2,250 | $10,190 |
| 2017 | $1,080 | $12,440 | $2,250 | $10,190 |
| 2016 | $872 | $12,270 | $2,390 | $9,880 |
| 2015 | $894 | $12,270 | $2,390 | $9,880 |
| 2014 | $859 | $11,840 | $2,150 | $9,690 |
Source: Public Records
Map
Nearby Homes
- 141 Hayes Dr
- 345 Libby Ct
- 490 Dix Cir
- 101 Security Blvd
- 576 Lindstrom Dr
- 99 Security Blvd
- 817 Grand Blvd
- 105 Easy St
- 335 Dix Cir
- 102 Security Blvd
- 89 Security Blvd
- 402 Grand Blvd
- 422 Hackberry Dr
- 80 Landoe Ln
- 6380 Southmoor Dr
- 95 Landoe Ln
- 633 Hackberry Dr
- 480 Athens Dr
- 102 Landoe Ln
- 1065 Harbourne St
- 155 Pointer Place
- 125 Pointer Place
- 515 Pucket Cir
- 563 Upton Dr
- 555 Upton Dr
- 571 Upton Dr
- 547 Upton Dr
- 525 Pucket Cir
- 115 Pointer Place
- 579 Upton Dr
- 539 Upton Dr
- 150 Pointer Place
- 535 Pucket Cir
- 140 Pointer Place
- 510 Pucket Cir
- 110 Pointer Place
- 531 Upton Dr
- 520 Pucket Cir
- 587 Upton Dr
- 130 Pointer Place