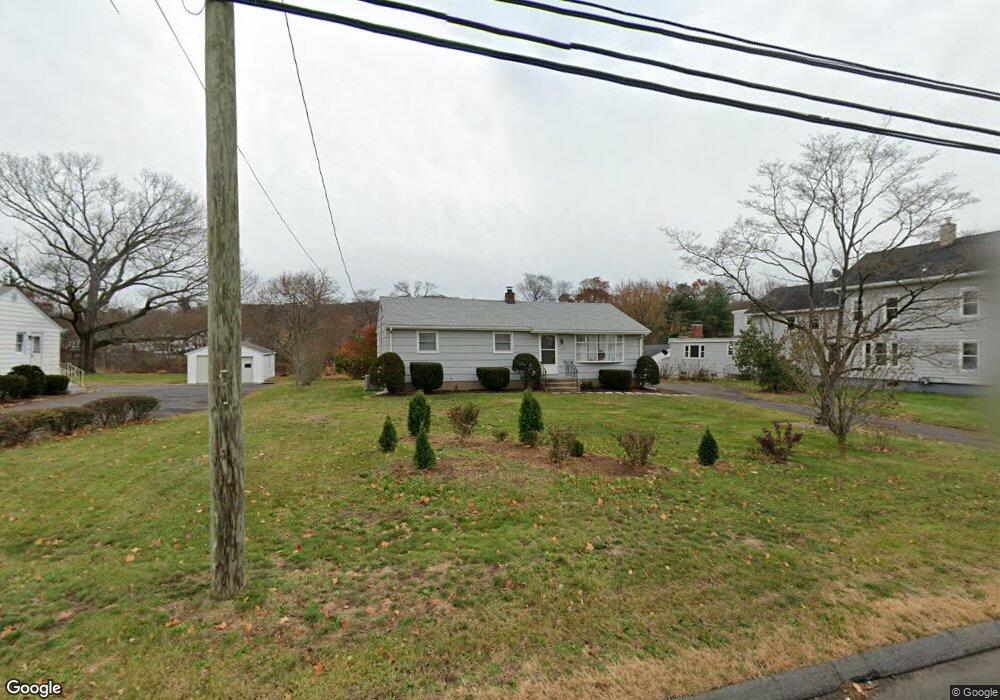
135 Quinnipiac Ave North Haven, CT 06473
Estimated Value: $272,000 - $344,034
3
Beds
2
Baths
1,056
Sq Ft
$281/Sq Ft
Est. Value
About This Home
This home is located at 135 Quinnipiac Ave, North Haven, CT 06473 and is currently estimated at $296,759, approximately $281 per square foot. 135 Quinnipiac Ave is a home located in New Haven County with nearby schools including North Haven Middle School, North Haven High School, and All Nations Christian Academy.
Ownership History
Date
Name
Owned For
Owner Type
Purchase Details
Closed on
Aug 14, 2024
Sold by
Kaczynski James R and Kaczynski Sally B
Bought by
Roffman Mark and Katz Judith
Current Estimated Value
Home Financials for this Owner
Home Financials are based on the most recent Mortgage that was taken out on this home.
Original Mortgage
$237,500
Outstanding Balance
$234,853
Interest Rate
6.95%
Mortgage Type
Purchase Money Mortgage
Estimated Equity
$61,906
Purchase Details
Closed on
Jul 18, 2022
Sold by
Kaczynski James R
Bought by
Kaczynski James R and Kaczynski Sally B
Purchase Details
Closed on
Oct 8, 2014
Sold by
Helen M Kaczynski T
Bought by
Kaczynski Tr Ronald S and Kaczynski James R
Purchase Details
Closed on
Aug 11, 2009
Sold by
Krusty Walter
Bought by
Helen M Kaczynski T and Tr Helen M Kaczyns
Create a Home Valuation Report for This Property
The Home Valuation Report is an in-depth analysis detailing your home's value as well as a comparison with similar homes in the area
Home Values in the Area
Average Home Value in this Area
Purchase History
| Date | Buyer | Sale Price | Title Company |
|---|---|---|---|
| Roffman Mark | $250,000 | None Available | |
| Roffman Mark | $250,000 | None Available | |
| Kaczynski James R | -- | None Available | |
| Kaczynski James R | -- | None Available | |
| Kaczynski Tr Ronald S | -- | -- | |
| Helen M Kaczynski T | -- | -- | |
| Kaczynski Tr Ronald S | -- | -- | |
| Helen M Kaczynski T M | -- | -- |
Source: Public Records
Mortgage History
| Date | Status | Borrower | Loan Amount |
|---|---|---|---|
| Open | Roffman Mark | $237,500 | |
| Closed | Roffman Mark | $237,500 |
Source: Public Records
Tax History Compared to Growth
Tax History
| Year | Tax Paid | Tax Assessment Tax Assessment Total Assessment is a certain percentage of the fair market value that is determined by local assessors to be the total taxable value of land and additions on the property. | Land | Improvement |
|---|---|---|---|---|
| 2025 | $5,320 | $180,600 | $59,500 | $121,100 |
| 2024 | $4,366 | $126,040 | $59,500 | $66,540 |
| 2023 | $4,115 | $126,040 | $59,500 | $66,540 |
| 2022 | $3,871 | $126,040 | $59,500 | $66,540 |
| 2021 | $3,871 | $126,040 | $59,500 | $66,540 |
| 2020 | $3,872 | $126,040 | $59,500 | $66,540 |
| 2019 | $4,097 | $131,390 | $70,000 | $61,390 |
| 2018 | $4,097 | $131,390 | $70,000 | $61,390 |
| 2017 | $4,018 | $131,390 | $70,000 | $61,390 |
| 2016 | $4,011 | $131,390 | $70,000 | $61,390 |
| 2015 | $3,865 | $131,390 | $70,000 | $61,390 |
| 2014 | $4,085 | $145,390 | $76,370 | $69,020 |
Source: Public Records
Map
Nearby Homes
- 35 Belvedere Rd
- 233 Quinnipiac Ave
- 61 Hermitage Ln
- 1 Pond View Cir Unit 1
- 100 Fitch St
- 81 Melrose Dr
- 55 Oak Ridge Dr Unit 60
- 7 Carolyn Ct
- 15 Glen Haven Rd
- 15 Zolan Dr
- 2 Gail Dr
- 300 Foxon Hill Rd
- 15 Turner Dr
- 7 Oak Hill Dr
- 174 Weybosset St
- 175 Weybosset St
- 170 Weybosset St
- 560 Middletown Ave
- 7 Jeffrey Rd
- 6 Birch Ln Unit L
- 133 Quinnipiac Ave
- 133 Quinnipiac Ave Unit Lower
- 141 Quinnipiac Ave
- 103 Quinnipiac Ave Unit 2nd Floor
- 129 Quinnipiac Ave
- 127 Quinnipiac Ave
- 151 Quinnipiac Ave
- 125 Quinnipiac Ave
- 11 Belmont Rd
- 10 Belmont Rd
- 13 Belmont Rd
- 15 Belmont Rd
- 30 Palmer Rd
- 17 Belmont Rd
- 9 Belmont Rd
- 26 Palmer Rd
- 120 Quinnipiac Ave
- 121 Quinnipiac Ave
- 7 Belmont Rd
- 19 Belmont Rd