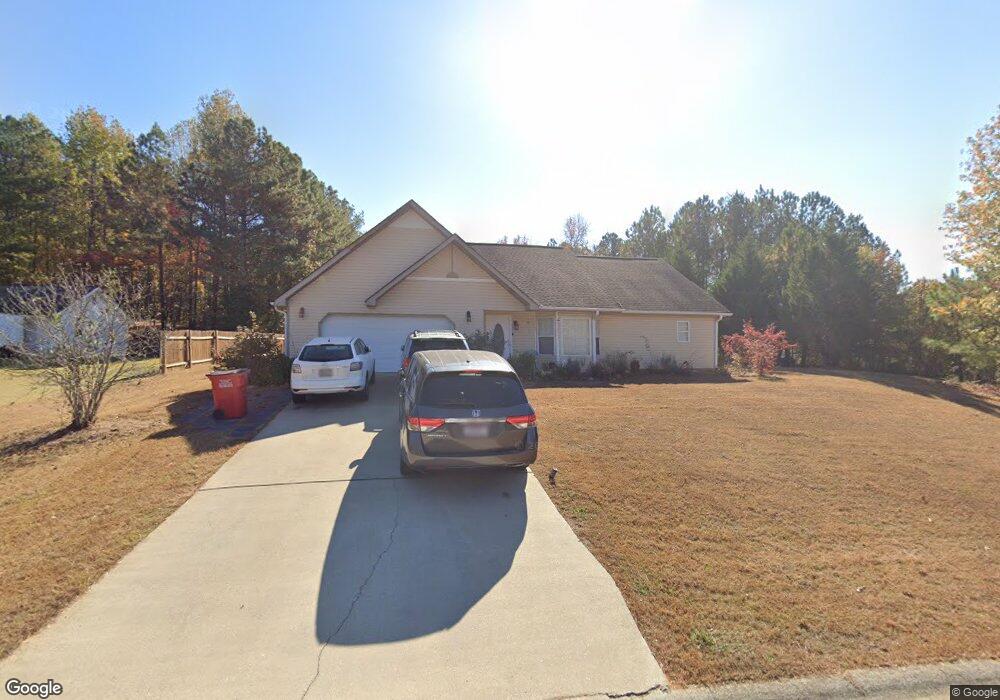
135 Ridge Way Unit 24 Braselton, GA 30517
Estimated Value: $331,000 - $376,000
3
Beds
2
Baths
1,850
Sq Ft
$196/Sq Ft
Est. Value
About This Home
This home is located at 135 Ridge Way Unit 24, Braselton, GA 30517 and is currently estimated at $361,941, approximately $195 per square foot. 135 Ridge Way Unit 24 is a home located in Jackson County with nearby schools including West Jackson Elementary School, West Jackson Middle School, and Jackson County High School.
Ownership History
Date
Name
Owned For
Owner Type
Purchase Details
Closed on
Oct 7, 2022
Sold by
Humphries Donald
Bought by
Kamal Faisal T and Kamal Riffat T
Current Estimated Value
Home Financials for this Owner
Home Financials are based on the most recent Mortgage that was taken out on this home.
Original Mortgage
$314,204
Outstanding Balance
$303,523
Interest Rate
6.62%
Mortgage Type
FHA
Estimated Equity
$58,418
Purchase Details
Closed on
Aug 17, 2018
Sold by
Boness Andrea E
Bought by
Humphries Donald
Purchase Details
Closed on
May 20, 2003
Sold by
Jennings Mark L and Jennings Delores S
Bought by
Boness Andrea E
Purchase Details
Closed on
Dec 4, 2001
Sold by
Manders Jeffery W
Bought by
Main Street Bank
Purchase Details
Closed on
Jul 30, 1998
Sold by
Manders Jeffery W
Bought by
Manders Jeffery W
Create a Home Valuation Report for This Property
The Home Valuation Report is an in-depth analysis detailing your home's value as well as a comparison with similar homes in the area
Home Values in the Area
Average Home Value in this Area
Purchase History
| Date | Buyer | Sale Price | Title Company |
|---|---|---|---|
| Kamal Faisal T | $320,000 | -- | |
| Humphries Donald | $176,500 | -- | |
| Boness Andrea E | $125,000 | -- | |
| Main Street Bank | $60,000 | -- | |
| Manders Jeffery W | -- | -- | |
| Manders Jeffery W | $45,000 | -- |
Source: Public Records
Mortgage History
| Date | Status | Borrower | Loan Amount |
|---|---|---|---|
| Open | Kamal Faisal T | $314,204 |
Source: Public Records
Tax History Compared to Growth
Tax History
| Year | Tax Paid | Tax Assessment Tax Assessment Total Assessment is a certain percentage of the fair market value that is determined by local assessors to be the total taxable value of land and additions on the property. | Land | Improvement |
|---|---|---|---|---|
| 2024 | $2,682 | $102,320 | $24,000 | $78,320 |
| 2023 | $2,709 | $93,120 | $24,000 | $69,120 |
| 2022 | $2,396 | $78,040 | $24,000 | $54,040 |
| 2021 | $2,035 | $65,840 | $11,800 | $54,040 |
| 2020 | $1,872 | $55,600 | $11,800 | $43,800 |
| 2019 | $1,899 | $55,600 | $11,800 | $43,800 |
| 2018 | $1,785 | $53,440 | $11,800 | $41,640 |
| 2017 | $1,779 | $52,856 | $11,800 | $41,056 |
| 2016 | $1,787 | $52,856 | $11,800 | $41,056 |
| 2015 | $1,703 | $50,256 | $9,200 | $41,056 |
| 2014 | $1,308 | $39,803 | $9,200 | $30,603 |
| 2013 | -- | $37,815 | $9,200 | $28,615 |
Source: Public Records
Map
Nearby Homes
- Ivy Plan at The Reserve At Liberty Park - Designer Collection
- Avery Plan at The Reserve At Liberty Park - Designer Collection
- Blair Plan at The Reserve At Liberty Park - Designer Collection
- Grandin Plan at The Reserve At Liberty Park - Designer Collection
- Wyatt Plan at The Reserve At Liberty Park - Designer Collection
- Linden Plan at The Reserve At Liberty Park - Designer Collection
- Charles Plan at The Reserve At Liberty Park - Designer Collection
- 50 Linden Ct
- Calvin Plan at The Reserve At Liberty Park - Designer Collection
- 606 Gold Crest Dr
- 7068 Highway 53
- 1413 Liberty Park Dr
- 60 Linden Ct
- 1046 Madison Ave
- 37 Linden Ct
- 1590 Adams Ave
- 799 Gold Crest Dr
- 916 Madison Ave
- 1740 Grant Ct
- 215 Hellen Valley Dr
- 135 Ridge Way
- 115 Ridge Way
- 195 Ridge Way
- 163 Pine Ridge Cir
- 237 Ridge Way
- 237 Ridge Way Unit 22
- 83 Ridge Way
- 83 Ridge Way Unit /26
- 156 Ridge Way
- 124 Ridge Way
- 331 Ridge Way
- 61 Ridge Way
- 315 Ridge Way
- 216 Ridge Way
- 168 Ridge Way
- 108 Ridge Way
- 238 Ridge Way
- 172 Ridge Way
- 84 Ridge Way
- 17 Ridge Way Unit 28