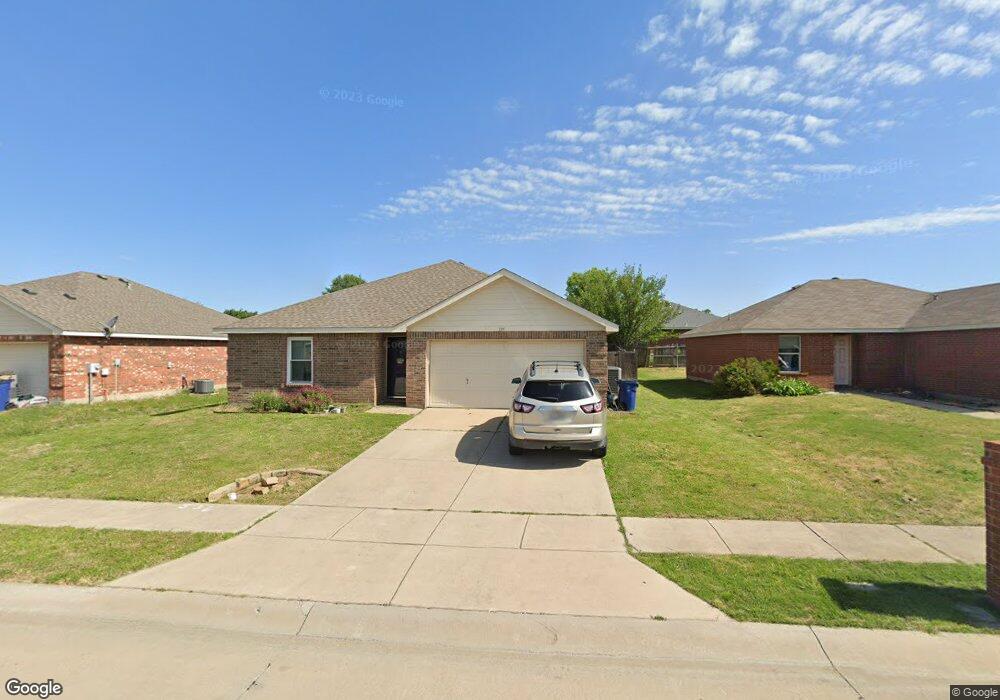
135 Ringneck Dr Sanger, TX 76266
Estimated Value: $286,233 - $299,000
4
Beds
2
Baths
1,760
Sq Ft
$168/Sq Ft
Est. Value
About This Home
This home is located at 135 Ringneck Dr, Sanger, TX 76266 and is currently estimated at $294,808, approximately $167 per square foot. 135 Ringneck Dr is a home located in Denton County with nearby schools including Chisholm Trail Elementary School, Clear Creek Intermediate School, and Sanger Sixth Grade Campus.
Ownership History
Date
Name
Owned For
Owner Type
Purchase Details
Closed on
Jun 19, 2020
Sold by
Smith Garrett and Smith Chelsea
Bought by
Hall Rachel Elaine
Current Estimated Value
Home Financials for this Owner
Home Financials are based on the most recent Mortgage that was taken out on this home.
Original Mortgage
$214,141
Outstanding Balance
$189,820
Interest Rate
3.2%
Mortgage Type
New Conventional
Estimated Equity
$104,988
Purchase Details
Closed on
Aug 6, 2018
Sold by
Marter Gene C and Marter Arlene
Bought by
Smith Garrett
Home Financials for this Owner
Home Financials are based on the most recent Mortgage that was taken out on this home.
Original Mortgage
$201,919
Interest Rate
4.5%
Mortgage Type
New Conventional
Purchase Details
Closed on
Aug 3, 2006
Sold by
Nuhome Of Texas
Bought by
Marter Mark
Home Financials for this Owner
Home Financials are based on the most recent Mortgage that was taken out on this home.
Original Mortgage
$24,098
Interest Rate
6.41%
Mortgage Type
Stand Alone Second
Create a Home Valuation Report for This Property
The Home Valuation Report is an in-depth analysis detailing your home's value as well as a comparison with similar homes in the area
Home Values in the Area
Average Home Value in this Area
Purchase History
| Date | Buyer | Sale Price | Title Company |
|---|---|---|---|
| Hall Rachel Elaine | -- | None Available | |
| Smith Garrett | -- | Osn Texas | |
| Marter Mark | -- | Natgf | |
| Nuhome Of Texas | -- | North American Title Co |
Source: Public Records
Mortgage History
| Date | Status | Borrower | Loan Amount |
|---|---|---|---|
| Open | Hall Rachel Elaine | $214,141 | |
| Previous Owner | Smith Garrett | $201,919 | |
| Previous Owner | Marter Mark | $24,098 | |
| Previous Owner | Nuhome Of Texas | $24,098 | |
| Previous Owner | Marter Mark | $96,350 |
Source: Public Records
Tax History Compared to Growth
Tax History
| Year | Tax Paid | Tax Assessment Tax Assessment Total Assessment is a certain percentage of the fair market value that is determined by local assessors to be the total taxable value of land and additions on the property. | Land | Improvement |
|---|---|---|---|---|
| 2025 | $4,969 | $301,092 | $69,300 | $231,792 |
| 2024 | $6,122 | $302,895 | $69,300 | $233,595 |
| 2023 | $4,445 | $290,000 | $53,589 | $236,411 |
| 2022 | $5,573 | $251,282 | $56,700 | $194,582 |
| 2021 | $4,562 | $217,061 | $45,675 | $171,386 |
| 2020 | $4,456 | $201,381 | $38,493 | $162,888 |
| 2019 | $4,566 | $200,554 | $38,493 | $162,061 |
| 2018 | $4,310 | $188,297 | $38,493 | $149,804 |
| 2017 | $4,015 | $174,561 | $38,493 | $136,068 |
| 2016 | $3,996 | $165,582 | $38,493 | $127,089 |
| 2015 | $2,987 | $138,068 | $24,192 | $113,876 |
| 2014 | $2,987 | $128,561 | $24,192 | $104,369 |
| 2013 | -- | $113,641 | $24,192 | $89,449 |
Source: Public Records
Map
Nearby Homes
- 204 Deer Run Dr
- 319 Quail Crossing Dr
- 124 Morning Glory
- 321 Quail Crossing Dr
- 185 Aster Dr
- 0000 Rector Rd
- 219 Hillcrest St
- 2000 S Stemmons St
- 2004 S Stemmons St
- 109 Colonial Heights
- 113 Diane Dr
- 117 Kathryn Dr
- 505 Houston St
- 315 Jones St
- 223 Jones St
- 212 N 4th St
- 213 S 6th St
- 710 W Willow St
- 109 S 5th St
- 702 La Paloma Rd
- 137 Ringneck Dr
- 133 Ringneck Dr
- 134 Pintail Ln
- 132 Pintail Ln
- 131 Ringneck Dr
- 139 Ringneck Dr
- 136 Pintail Dr
- 136 Pintail Ln
- 130 Pintail Ln
- 134 Ringneck Dr
- 136 Ringneck Dr
- 138 Pintail Ln
- 129 Ringneck Dr
- 132 Ringneck Dr
- 141 Ringneck Dr
- 138 Ringneck Dr
- 128 Pintail Ln
- 130 Ringneck Dr
- 140 Pintail Ln
- 140 Ringneck Dr