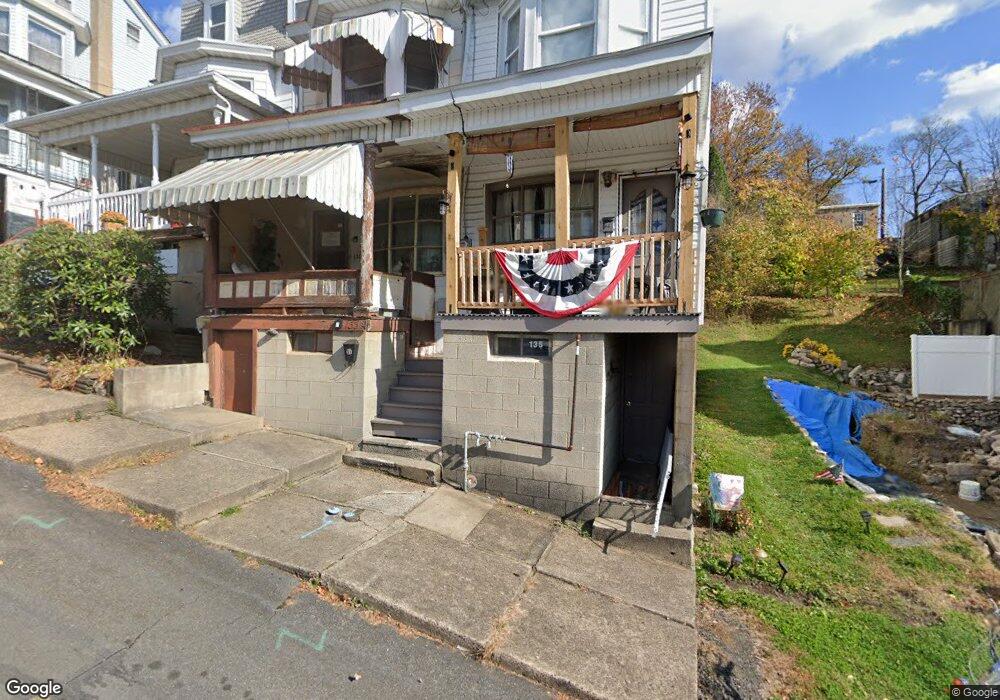
135 S 7th St Shamokin, PA 17872
Estimated Value: $71,000 - $89,000
3
Beds
3
Baths
1,420
Sq Ft
$56/Sq Ft
Est. Value
About This Home
This home is located at 135 S 7th St, Shamokin, PA 17872 and is currently estimated at $79,607, approximately $56 per square foot. 135 S 7th St is a home located in Northumberland County with nearby schools including Shamokin Area Elementary School, Shamokin Area Middle School, and Shamokin Area High School.
Ownership History
Date
Name
Owned For
Owner Type
Purchase Details
Closed on
Jul 25, 2022
Sold by
Lamplight Leasing Llc
Bought by
Engel Matthew and Engel Jessica
Current Estimated Value
Home Financials for this Owner
Home Financials are based on the most recent Mortgage that was taken out on this home.
Original Mortgage
$54,887
Outstanding Balance
$52,282
Interest Rate
5.23%
Mortgage Type
FHA
Estimated Equity
$27,325
Purchase Details
Closed on
Aug 8, 2018
Sold by
Wayand Nicolette M
Bought by
Lamplight Leasing Llc
Purchase Details
Closed on
Dec 8, 2015
Sold by
Hill Michael L and Wayand Nicolette M
Bought by
Wayand Nicolette M
Purchase Details
Closed on
Nov 26, 2007
Sold by
Kiefaber Timothy A
Bought by
Hill Michael L and Addario Nicolette M
Purchase Details
Closed on
Aug 30, 2007
Sold by
Rogers Michael J and Rogers Brenda K
Bought by
Kiefaber Timothy A
Create a Home Valuation Report for This Property
The Home Valuation Report is an in-depth analysis detailing your home's value as well as a comparison with similar homes in the area
Home Values in the Area
Average Home Value in this Area
Purchase History
| Date | Buyer | Sale Price | Title Company |
|---|---|---|---|
| Engel Matthew | $55,900 | Madison Settlement Services | |
| Lamplight Leasing Llc | $32,361 | None Available | |
| Wayand Nicolette M | $11,290 | None Available | |
| Hill Michael L | $7,500 | First American Title Insuran | |
| Kiefaber Timothy A | $4,000 | None Available |
Source: Public Records
Mortgage History
| Date | Status | Borrower | Loan Amount |
|---|---|---|---|
| Open | Engel Matthew | $54,887 |
Source: Public Records
Tax History Compared to Growth
Tax History
| Year | Tax Paid | Tax Assessment Tax Assessment Total Assessment is a certain percentage of the fair market value that is determined by local assessors to be the total taxable value of land and additions on the property. | Land | Improvement |
|---|---|---|---|---|
| 2025 | $905 | $6,700 | $280 | $6,420 |
| 2024 | $851 | $6,700 | $280 | $6,420 |
| 2023 | $851 | $6,700 | $280 | $6,420 |
| 2022 | $838 | $6,700 | $280 | $6,420 |
| 2021 | $828 | $6,700 | $280 | $6,420 |
| 2020 | $819 | $6,700 | $280 | $6,420 |
| 2019 | $807 | $6,700 | $280 | $6,420 |
| 2018 | $799 | $6,700 | $280 | $6,420 |
| 2017 | $769 | $6,700 | $280 | $6,420 |
| 2016 | -- | $6,700 | $280 | $6,420 |
| 2015 | -- | $6,700 | $280 | $6,420 |
| 2014 | -- | $6,700 | $280 | $6,420 |
Source: Public Records
Map
Nearby Homes
- 140 S Market St
- 12 S Grant St
- 17 N Anthracite St
- 319 S Market St
- 1 N Grant St
- 347 S 7th St
- 207 S 6th St
- 17 N Grant St
- 212 E Chestnut St
- 338 S Market St
- 123 S 5th St
- 135 W Montgomery St
- 114 S 5th St
- 132 N 8th St
- 206 S Shamokin St
- 312 S 5th St
- 16 N Rock St
- 242 S Shamokin St
- 115 N Marshall St
- 303 S Rock St