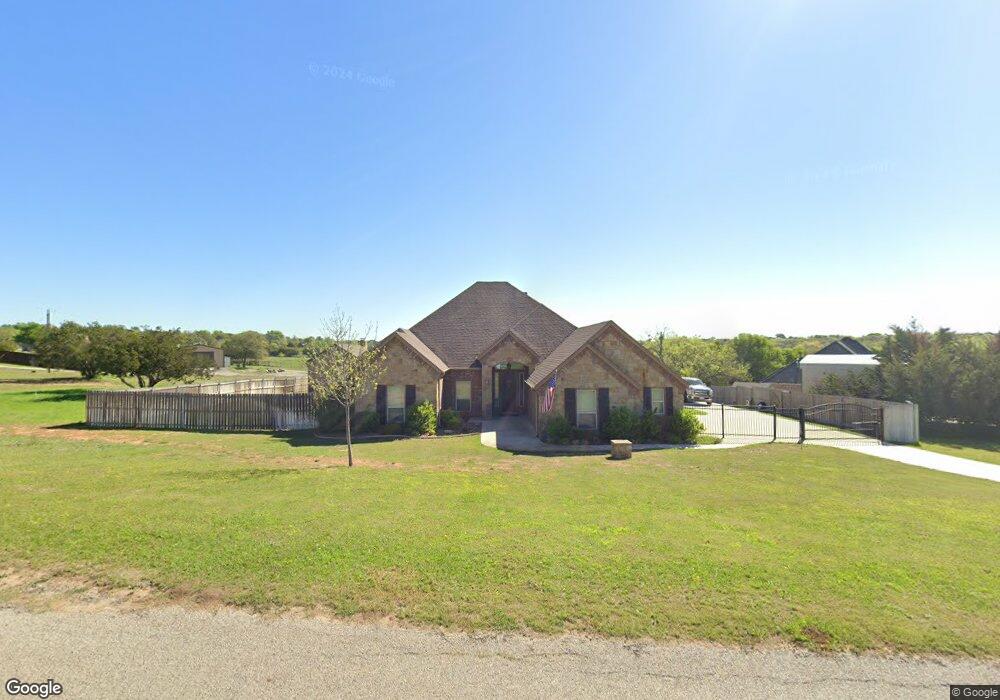
135 Sandy Creek Trail Weatherford, TX 76085
Estimated Value: $628,000 - $659,000
4
Beds
2
Baths
2,424
Sq Ft
$267/Sq Ft
Est. Value
About This Home
This home is located at 135 Sandy Creek Trail, Weatherford, TX 76085 and is currently estimated at $647,510, approximately $267 per square foot. 135 Sandy Creek Trail is a home located in Parker County with nearby schools including Crockett Elementary School, Tison Middle School, and Weatherford High School.
Ownership History
Date
Name
Owned For
Owner Type
Purchase Details
Closed on
Mar 24, 2017
Sold by
Larr Nicholas D and Larr Jamie N
Bought by
Salas Jaun and Salas Angela
Current Estimated Value
Home Financials for this Owner
Home Financials are based on the most recent Mortgage that was taken out on this home.
Original Mortgage
$278,437
Outstanding Balance
$230,895
Interest Rate
4.17%
Mortgage Type
VA
Estimated Equity
$416,615
Purchase Details
Closed on
Jul 8, 2014
Sold by
Ray French Land Company Ltd
Bought by
Salas Juan and Salas Angela
Home Financials for this Owner
Home Financials are based on the most recent Mortgage that was taken out on this home.
Original Mortgage
$257,350
Interest Rate
4.18%
Mortgage Type
New Conventional
Purchase Details
Closed on
Oct 3, 2013
Sold by
Weatherford Sandy Creek Ranch Lp
Bought by
Salas Juan and Salas Angela
Purchase Details
Closed on
Nov 14, 2001
Bought by
Salas Juan and Salas Angela
Create a Home Valuation Report for This Property
The Home Valuation Report is an in-depth analysis detailing your home's value as well as a comparison with similar homes in the area
Home Values in the Area
Average Home Value in this Area
Purchase History
| Date | Buyer | Sale Price | Title Company |
|---|---|---|---|
| Salas Jaun | -- | Providence Title Company | |
| Salas Juan | -- | -- | |
| Larr Nicholas D | -- | Providence Title Company | |
| Salas Juan | -- | -- | |
| Salas Juan | -- | -- |
Source: Public Records
Mortgage History
| Date | Status | Borrower | Loan Amount |
|---|---|---|---|
| Open | Salas Jaun | $278,437 | |
| Previous Owner | Larr Nicholas D | $257,350 |
Source: Public Records
Tax History Compared to Growth
Tax History
| Year | Tax Paid | Tax Assessment Tax Assessment Total Assessment is a certain percentage of the fair market value that is determined by local assessors to be the total taxable value of land and additions on the property. | Land | Improvement |
|---|---|---|---|---|
| 2025 | $6,589 | $577,492 | -- | -- |
| 2024 | $6,589 | $521,675 | -- | -- |
| 2023 | $6,589 | $474,250 | $0 | $0 |
| 2022 | $8,027 | $431,140 | $80,770 | $350,370 |
| 2021 | $7,274 | $361,140 | $80,770 | $280,370 |
| 2020 | $6,907 | $340,550 | $55,790 | $284,760 |
| 2019 | $7,179 | $340,550 | $55,790 | $284,760 |
| 2018 | $6,561 | $301,630 | $24,720 | $276,910 |
| 2017 | $6,502 | $301,630 | $24,720 | $276,910 |
| 2016 | $5,910 | $266,280 | $24,720 | $241,560 |
| 2015 | $5,394 | $264,280 | $24,720 | $239,560 |
| 2014 | $219 | $10,300 | $10,300 | $0 |
Source: Public Records
Map
Nearby Homes
- Lot 118 Stonebridge Dr
- Lot 117 Stonebridge Dr
- 368 Green Branch Rd
- 107 W Stagecoach Trail
- 104 W Stagecoach Trail
- 737 Green Branch Rd
- 161 Cochran Rd
- 901 Green Branch Rd
- 3930 Old Springtown Rd
- 401 Old Agnes Rd
- 171 Jupiter Trail
- 280 Jupiter Trail
- 300 Jupiter Trail
- 309 Old Agnes Rd
- 400 Texas Sage Trail
- 524 Lantana Dr
- Aster Plan at Eagle Ridge Estates
- Cedar Sage Plan at Eagle Ridge Estates
- 408 Texas Sage Trail
- 424 Texas Sage Trail
- 151 Sandy Creek Trail
- 129 Sandy Creek Trail
- 136 Sandy Creek Trail
- 300 Sandy Creek Ct
- 490 Baggett Rd
- 170 Sandy Creek Trail
- 121 Sandy Creek Trail
- 308 Sandy Creek Ct
- 176 Sandy Creek Trail
- 183 Sandy Creek Trail
- 301 Sandy Creek Ct
- 460 Baggett Rd
- 109 Sandy Creek Trail
- 184 Sandy Creek Trail
- 118 Sandy Creek Trail
- 491 Baggett Rd
- 0000 Sandy Creek Trail
- TBD Sandy Creek Trail
- 316 Sandy Creek Ct
- 324 Sandy Creek Ct