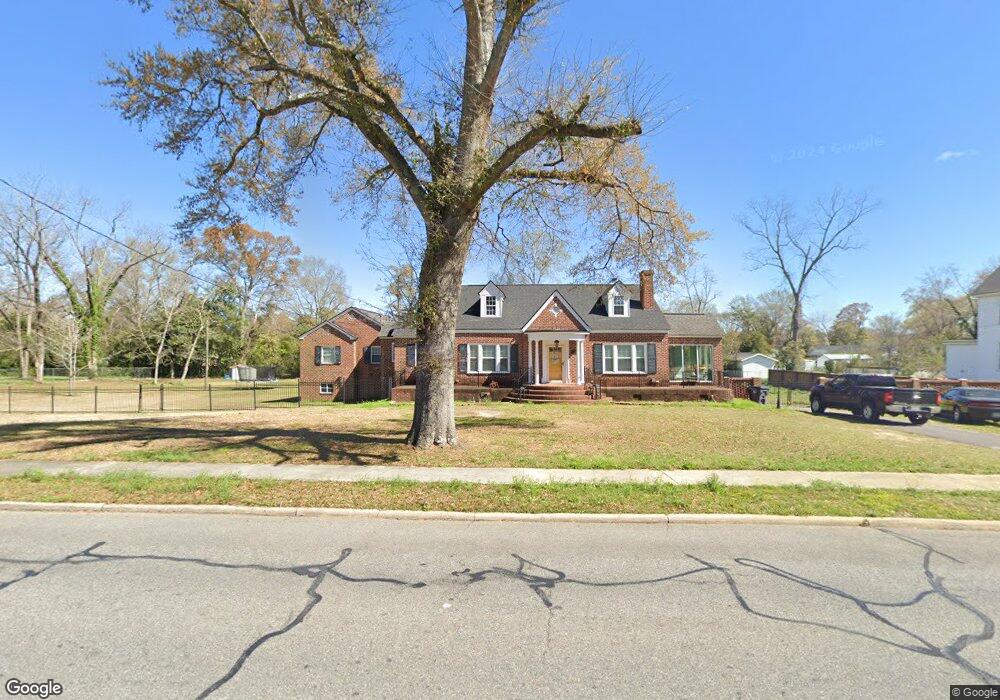
135 SE 2nd St Cochran, GA 31014
Estimated Value: $277,000 - $331,523
--
Bed
4
Baths
2,801
Sq Ft
$108/Sq Ft
Est. Value
About This Home
This home is located at 135 SE 2nd St, Cochran, GA 31014 and is currently estimated at $301,381, approximately $107 per square foot. 135 SE 2nd St is a home located in Bleckley County with nearby schools including Bleckley County Primary School, Bleckley County Elementary School, and Bleckley Middle School.
Ownership History
Date
Name
Owned For
Owner Type
Purchase Details
Closed on
May 11, 2015
Sold by
Deavers Tracey A
Bought by
Rambo Lindsay K
Current Estimated Value
Home Financials for this Owner
Home Financials are based on the most recent Mortgage that was taken out on this home.
Original Mortgage
$125,510
Outstanding Balance
$96,933
Interest Rate
3.75%
Mortgage Type
New Conventional
Estimated Equity
$204,448
Purchase Details
Closed on
Aug 29, 2008
Sold by
Johnson Jason and Johnson Tracey
Bought by
Deavers Tracey A and Deavers Shannon
Purchase Details
Closed on
May 27, 2003
Sold by
Phillips Leo L and Phillips John Robert
Bought by
Johnson Jason and Johnson Tracey
Purchase Details
Closed on
Dec 12, 2001
Sold by
Phillips Phillips L and Phillips L
Bought by
Phillips Leo L and Phillips John Robert
Purchase Details
Closed on
May 10, 1955
Bought by
Phillips Phillips L and Phillips L
Create a Home Valuation Report for This Property
The Home Valuation Report is an in-depth analysis detailing your home's value as well as a comparison with similar homes in the area
Home Values in the Area
Average Home Value in this Area
Purchase History
| Date | Buyer | Sale Price | Title Company |
|---|---|---|---|
| Rambo Lindsay K | $120,000 | -- | |
| Deavers Tracey A | $175,000 | -- | |
| Johnson Jason | $98,000 | -- | |
| Phillips Leo L | -- | -- | |
| Phillips Phillips L | -- | -- |
Source: Public Records
Mortgage History
| Date | Status | Borrower | Loan Amount |
|---|---|---|---|
| Open | Rambo Lindsay K | $125,510 |
Source: Public Records
Tax History Compared to Growth
Tax History
| Year | Tax Paid | Tax Assessment Tax Assessment Total Assessment is a certain percentage of the fair market value that is determined by local assessors to be the total taxable value of land and additions on the property. | Land | Improvement |
|---|---|---|---|---|
| 2024 | $4,578 | $122,920 | $8,800 | $114,120 |
| 2023 | $4,640 | $114,920 | $8,800 | $106,120 |
| 2022 | $2,733 | $102,440 | $8,800 | $93,640 |
| 2021 | $2,203 | $79,560 | $8,800 | $70,760 |
| 2020 | $2,212 | $79,560 | $8,800 | $70,760 |
| 2019 | $1,203 | $44,186 | $12,000 | $32,186 |
| 2018 | $1,786 | $44,186 | $12,000 | $32,186 |
| 2017 | $1,218 | $44,186 | $12,000 | $32,186 |
| 2016 | $1,230 | $44,186 | $12,000 | $32,186 |
| 2015 | -- | $44,186 | $12,000 | $32,186 |
| 2014 | -- | $44,186 | $12,000 | $32,186 |
| 2013 | -- | $44,186 | $12,000 | $32,186 |
Source: Public Records
Map
Nearby Homes
- 142 Rose St
- 119 S 4th St
- 1277 Georgia 112
- 118 S 5th St
- 123 S 5th St
- 0 Tiffany Dr Unit 10525322
- 115 Plantation Dr
- 134 Easy St
- 112 Pecan St
- 118 Pecan St
- 116 Pecan St
- 140 Racetrack Dr
- 0 Willow Creek Run
- 116 Jackson St
- 151 N 7th St
- 105 Hillcrest Dr
- 157 10th St SE
- 260 Ann St
- 264 Ann St
- RV Park Mac Thompson Rd