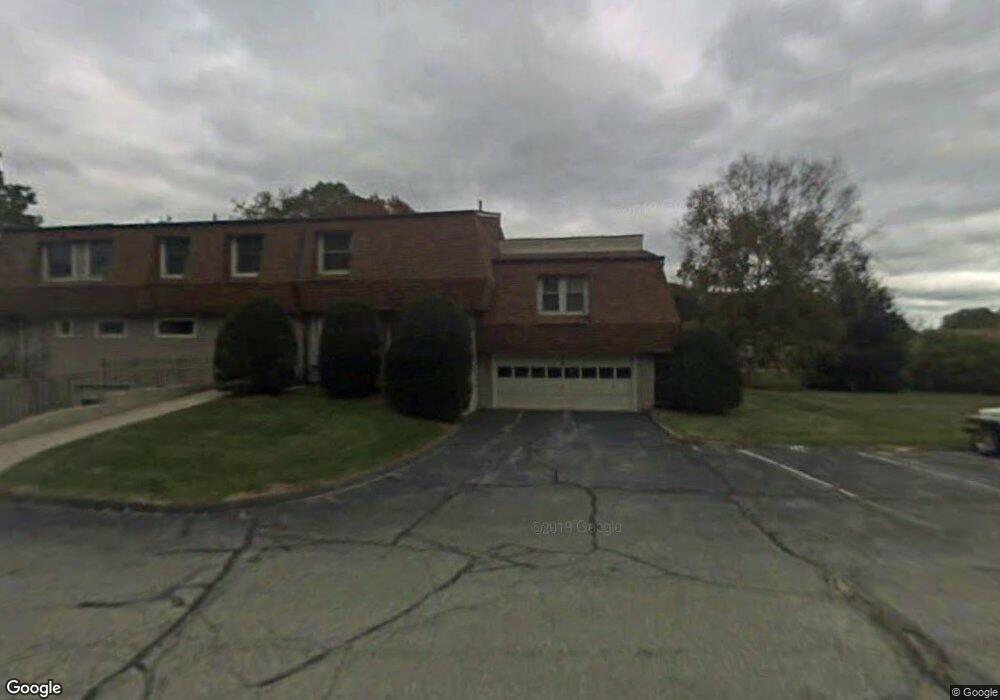
135 Sheraton Ln Norwich, CT 06360
East Great Plains NeighborhoodEstimated Value: $221,209 - $239,000
2
Beds
2
Baths
1,320
Sq Ft
$174/Sq Ft
Est. Value
About This Home
This home is located at 135 Sheraton Ln, Norwich, CT 06360 and is currently estimated at $229,302, approximately $173 per square foot. 135 Sheraton Ln is a home located in New London County with nearby schools including Thomas W. Mahan Elementary School, Teachers' Memorial Global Studies Magnet Middle, and Wildwood Christian School.
Ownership History
Date
Name
Owned For
Owner Type
Purchase Details
Closed on
Mar 23, 2023
Sold by
Nadeau Brandon K and Johnson Natalie
Bought by
George Jeff
Current Estimated Value
Home Financials for this Owner
Home Financials are based on the most recent Mortgage that was taken out on this home.
Original Mortgage
$130,950
Outstanding Balance
$126,683
Interest Rate
6.12%
Mortgage Type
Purchase Money Mortgage
Estimated Equity
$102,619
Purchase Details
Closed on
Sep 21, 2022
Sold by
Nadeau Brandon K
Bought by
Johnson Natalie and Nadeau Brandon K
Purchase Details
Closed on
Nov 10, 2011
Sold by
Bright Eva
Bought by
Nadeau Brandon K
Home Financials for this Owner
Home Financials are based on the most recent Mortgage that was taken out on this home.
Original Mortgage
$80,000
Interest Rate
4.01%
Mortgage Type
Purchase Money Mortgage
Create a Home Valuation Report for This Property
The Home Valuation Report is an in-depth analysis detailing your home's value as well as a comparison with similar homes in the area
Home Values in the Area
Average Home Value in this Area
Purchase History
| Date | Buyer | Sale Price | Title Company |
|---|---|---|---|
| George Jeff | $135,000 | None Available | |
| George Jeff | $135,000 | None Available | |
| Johnson Natalie | -- | None Available | |
| Johnson Natalie | -- | None Available | |
| Nadeau Brandon K | $100,000 | -- | |
| Nadeau Brandon K | $100,000 | -- |
Source: Public Records
Mortgage History
| Date | Status | Borrower | Loan Amount |
|---|---|---|---|
| Open | George Jeff | $130,950 | |
| Closed | George Jeff | $130,950 | |
| Previous Owner | Nadeau Brandon K | $80,000 | |
| Previous Owner | Nadeau Brandon K | $195,000 | |
| Previous Owner | Nadeau Brandon K | $35,000 |
Source: Public Records
Tax History Compared to Growth
Tax History
| Year | Tax Paid | Tax Assessment Tax Assessment Total Assessment is a certain percentage of the fair market value that is determined by local assessors to be the total taxable value of land and additions on the property. | Land | Improvement |
|---|---|---|---|---|
| 2025 | $3,457 | $99,300 | $0 | $99,300 |
| 2024 | $3,302 | $99,300 | $0 | $99,300 |
| 2023 | $2,921 | $69,800 | $0 | $69,800 |
| 2022 | $2,944 | $69,800 | $0 | $69,800 |
| 2021 | $2,956 | $69,800 | $0 | $69,800 |
| 2020 | $2,958 | $69,800 | $0 | $69,800 |
| 2019 | $2,837 | $69,800 | $0 | $69,800 |
| 2018 | $2,442 | $58,900 | $0 | $58,900 |
| 2017 | $2,395 | $58,900 | $0 | $58,900 |
| 2016 | $2,456 | $58,900 | $0 | $58,900 |
| 2015 | $2,438 | $58,900 | $0 | $58,900 |
| 2014 | $2,299 | $58,900 | $0 | $58,900 |
Source: Public Records
Map
Nearby Homes
- 150 Sheraton Ln Unit 150
- 123 Sheraton Ln Unit 123
- 118 Sheraton Ln
- 73 Briar Ln Unit 73
- 0 Briar Ln Unit 20
- 4 Maplewood Ct
- 33 Briar Hill Rd
- 31 Benedict Crossing
- 64 Sherwood Ln
- 67 Briar Hill Rd
- 2 Dellwood Rd
- 79 Briar Hill Rd
- 27 Sycamore Rd
- 346 Salem Turnpike
- 8 Dogwood Ln
- 244 Leffingwell Rd
- 0 Old Salem Rd Unit N10056613
- 9 Deerbrook Rd
- 19 Desjardins Dr
- 215 Wawecus Hill Rd
- 133 Sheraton Ln
- 137 Sheraton Ln
- 135 Sheraton Ln Unit 135
- 133 Sheraton Ln Unit 133
- 143 Sheraton Ln
- 139 Sheraton Ln
- 141 Sheraton Ln
- 143 Sheraton Ln Unit 143
- 131 Sheraton Ln
- 131 Sheraton Ln Unit 131
- 147 Sheraton Ln
- 145 Sheraton Ln
- 145 Sheraton Ln Unit 145
- 147 Sheraton Ln Unit 147
- 145 Sheraton Ln Unit 2-8
- 134 Sheraton Ln
- 138 Sheraton Ln
- 142 Sheraton Ln
- 142 Sheraton Ln Unit 1-6
- 142 Sheraton Ln Unit 142