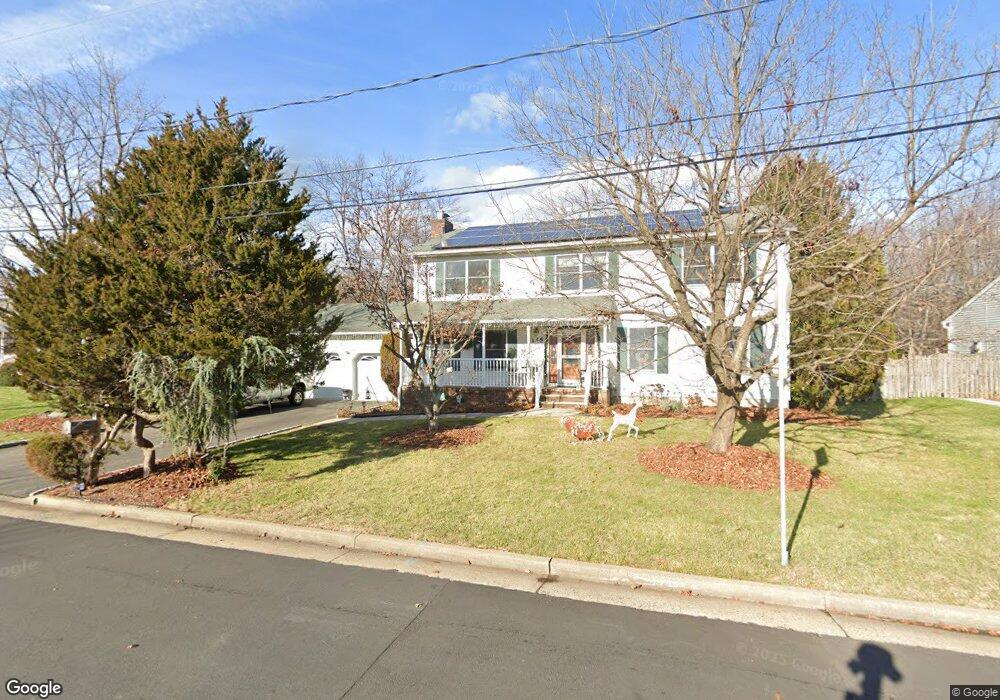
135 Smith St South Plainfield, NJ 07080
Estimated Value: $769,685 - $904,000
--
Bed
--
Bath
2,312
Sq Ft
$364/Sq Ft
Est. Value
About This Home
This home is located at 135 Smith St, South Plainfield, NJ 07080 and is currently estimated at $841,421, approximately $363 per square foot. 135 Smith St is a home located in Middlesex County with nearby schools including South Plainfield High School, Holy Savior Academy, and Primrose School of North Edison.
Ownership History
Date
Name
Owned For
Owner Type
Purchase Details
Closed on
Sep 2, 2005
Sold by
Keith Addie
Bought by
Robak Terrence and Robak Rebecca
Current Estimated Value
Home Financials for this Owner
Home Financials are based on the most recent Mortgage that was taken out on this home.
Original Mortgage
$320,000
Outstanding Balance
$171,953
Interest Rate
5.92%
Estimated Equity
$669,468
Purchase Details
Closed on
Apr 6, 2004
Sold by
Maniscalco Peter
Bought by
Keith Addie and Addie Michelle
Create a Home Valuation Report for This Property
The Home Valuation Report is an in-depth analysis detailing your home's value as well as a comparison with similar homes in the area
Home Values in the Area
Average Home Value in this Area
Purchase History
| Date | Buyer | Sale Price | Title Company |
|---|---|---|---|
| Robak Terrence | $539,900 | -- | |
| Keith Addie | $442,000 | -- |
Source: Public Records
Mortgage History
| Date | Status | Borrower | Loan Amount |
|---|---|---|---|
| Open | Robak Terrence | $320,000 |
Source: Public Records
Tax History Compared to Growth
Tax History
| Year | Tax Paid | Tax Assessment Tax Assessment Total Assessment is a certain percentage of the fair market value that is determined by local assessors to be the total taxable value of land and additions on the property. | Land | Improvement |
|---|---|---|---|---|
| 2025 | $12,623 | $180,800 | $41,500 | $139,300 |
| 2024 | $12,074 | $180,800 | $41,500 | $139,300 |
| 2023 | $12,074 | $180,800 | $41,500 | $139,300 |
| 2022 | $11,924 | $180,800 | $41,500 | $139,300 |
| 2021 | $10,085 | $180,800 | $41,500 | $139,300 |
| 2020 | $11,474 | $180,800 | $41,500 | $139,300 |
| 2019 | $11,009 | $180,800 | $41,500 | $139,300 |
| 2018 | $10,725 | $180,800 | $41,500 | $139,300 |
| 2017 | $10,588 | $180,800 | $41,500 | $139,300 |
| 2016 | $10,481 | $180,800 | $41,500 | $139,300 |
| 2015 | $10,300 | $180,800 | $41,500 | $139,300 |
| 2014 | $10,004 | $180,800 | $41,500 | $139,300 |
Source: Public Records
Map
Nearby Homes