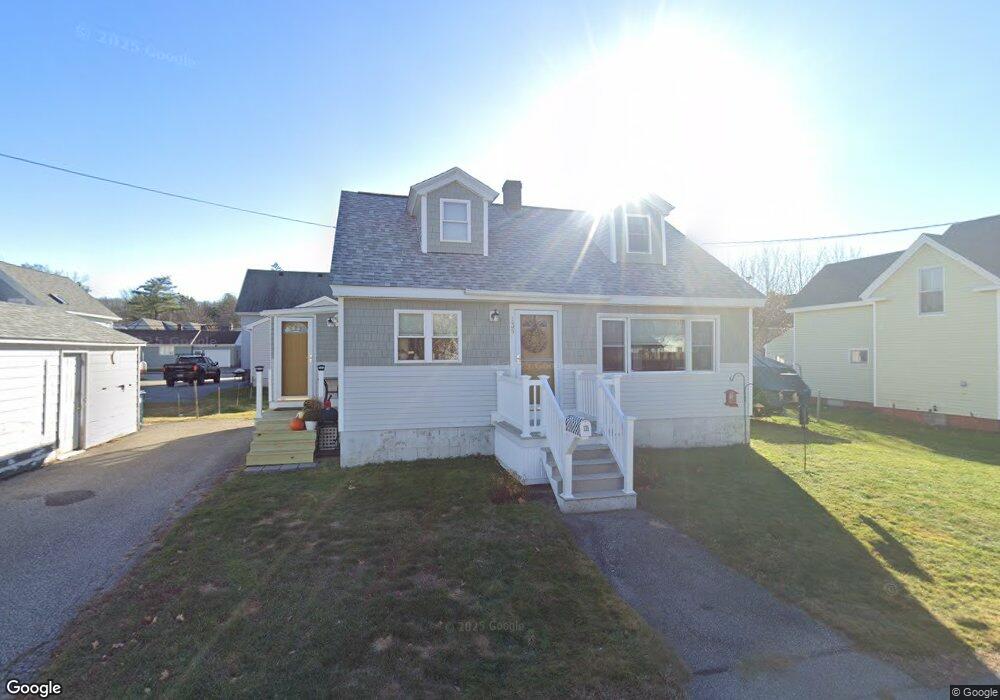
135 Summer St Biddeford, ME 04005
Estimated Value: $393,000 - $410,000
3
Beds
1
Bath
1,344
Sq Ft
$296/Sq Ft
Est. Value
About This Home
This home is located at 135 Summer St, Biddeford, ME 04005 and is currently estimated at $397,556, approximately $295 per square foot. 135 Summer St is a home located in York County with nearby schools including John F Kennedy Memorial School, Biddeford Primary School, and Biddeford Intermediate School.
Ownership History
Date
Name
Owned For
Owner Type
Purchase Details
Closed on
Mar 10, 2005
Sold by
Carrier Rachel P and Carrier Gerard M
Bought by
Fields Todd L
Current Estimated Value
Home Financials for this Owner
Home Financials are based on the most recent Mortgage that was taken out on this home.
Original Mortgage
$152,000
Outstanding Balance
$22,327
Interest Rate
5.64%
Mortgage Type
Purchase Money Mortgage
Estimated Equity
$375,229
Create a Home Valuation Report for This Property
The Home Valuation Report is an in-depth analysis detailing your home's value as well as a comparison with similar homes in the area
Home Values in the Area
Average Home Value in this Area
Purchase History
| Date | Buyer | Sale Price | Title Company |
|---|---|---|---|
| Fields Todd L | -- | -- | |
| Fields Todd L | -- | -- | |
| Fields Todd L | -- | -- |
Source: Public Records
Mortgage History
| Date | Status | Borrower | Loan Amount |
|---|---|---|---|
| Open | Fields Todd L | $15,000 | |
| Open | Fields Todd L | $152,000 | |
| Closed | Fields Todd L | $152,000 |
Source: Public Records
Tax History
| Year | Tax Paid | Tax Assessment Tax Assessment Total Assessment is a certain percentage of the fair market value that is determined by local assessors to be the total taxable value of land and additions on the property. | Land | Improvement |
|---|---|---|---|---|
| 2025 | $4,225 | $282,800 | $135,100 | $147,700 |
| 2024 | $4,149 | $291,800 | $135,100 | $156,700 |
| 2023 | $3,797 | $289,400 | $132,700 | $156,700 |
| 2022 | $3,625 | $220,900 | $74,000 | $146,900 |
| 2021 | $3,378 | $185,300 | $62,700 | $122,600 |
| 2020 | $3,384 | $168,800 | $57,000 | $111,800 |
| 2019 | $3,373 | $168,800 | $57,000 | $111,800 |
| 2018 | $3,325 | $168,800 | $57,000 | $111,800 |
| 2017 | $3,306 | $164,700 | $57,000 | $107,700 |
| 2016 | $3,271 | $164,700 | $57,000 | $107,700 |
| 2015 | $3,012 | $164,700 | $57,000 | $107,700 |
| 2014 | $2,947 | $165,200 | $57,000 | $108,200 |
| 2013 | -- | $168,700 | $56,500 | $112,200 |
Source: Public Records
Map
Nearby Homes
- 155 Hill St
- 17 Granite St
- 7 Willett St
- 5 Oak Place
- 109 Alfred St
- 36-38 Pool St
- 66 Graham St
- 84 Pike St
- 11 King St
- 276 Hill St
- 16 Hill St
- 12 Kossuth St
- 11 Chadwick Place
- 4 Kossuth St
- 5 Penny Ave
- 2 Main St Unit 15-311
- 2 Main St Unit 17-407
- 2 Main St Unit 15-502
- 2 Main St Unit 18-501
- 2 Main St Unit 17-416
Your Personal Tour Guide
Ask me questions while you tour the home.