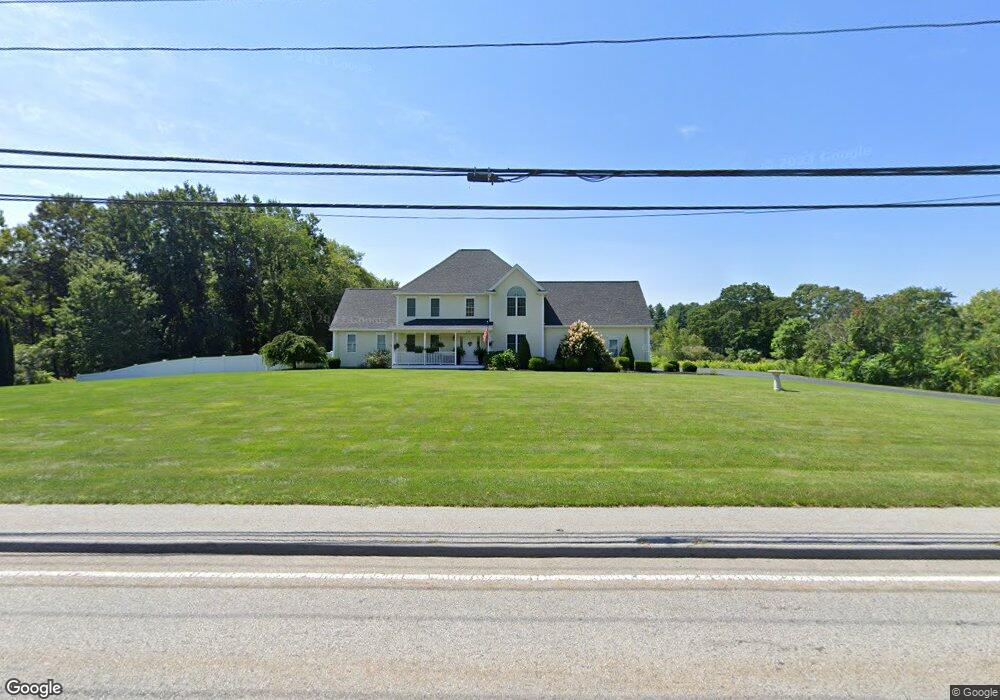
135 Sutton Ave Oxford, MA 01540
Estimated Value: $645,000 - $721,000
4
Beds
3
Baths
2,822
Sq Ft
$238/Sq Ft
Est. Value
About This Home
This home is located at 135 Sutton Ave, Oxford, MA 01540 and is currently estimated at $670,629, approximately $237 per square foot. 135 Sutton Ave is a home located in Worcester County with nearby schools including Alfred M Chaffee, Oxford High School, and Clara Barton Elementary School.
Ownership History
Date
Name
Owned For
Owner Type
Purchase Details
Closed on
Jul 2, 2007
Sold by
Conway Michael F
Bought by
Conway Angela S and Conway Michael F
Current Estimated Value
Home Financials for this Owner
Home Financials are based on the most recent Mortgage that was taken out on this home.
Original Mortgage
$276,000
Outstanding Balance
$170,153
Interest Rate
6.24%
Mortgage Type
Purchase Money Mortgage
Estimated Equity
$500,477
Purchase Details
Closed on
Nov 27, 2006
Sold by
Shultz Barbara T
Bought by
Conway Michael F
Home Financials for this Owner
Home Financials are based on the most recent Mortgage that was taken out on this home.
Original Mortgage
$271,065
Interest Rate
6.39%
Mortgage Type
Purchase Money Mortgage
Create a Home Valuation Report for This Property
The Home Valuation Report is an in-depth analysis detailing your home's value as well as a comparison with similar homes in the area
Home Values in the Area
Average Home Value in this Area
Purchase History
| Date | Buyer | Sale Price | Title Company |
|---|---|---|---|
| Conway Angela S | -- | -- | |
| Conway Michael F | $127,500 | -- |
Source: Public Records
Mortgage History
| Date | Status | Borrower | Loan Amount |
|---|---|---|---|
| Open | Conway Angela S | $276,000 | |
| Previous Owner | Conway Michael F | $271,065 |
Source: Public Records
Tax History
| Year | Tax Paid | Tax Assessment Tax Assessment Total Assessment is a certain percentage of the fair market value that is determined by local assessors to be the total taxable value of land and additions on the property. | Land | Improvement |
|---|---|---|---|---|
| 2025 | $82 | $648,900 | $121,700 | $527,200 |
| 2024 | $8,170 | $606,100 | $115,500 | $490,600 |
| 2023 | $7,566 | $554,700 | $110,500 | $444,200 |
| 2022 | $7,332 | $453,700 | $85,300 | $368,400 |
| 2021 | $7,080 | $428,300 | $80,900 | $347,400 |
| 2020 | $6,826 | $409,700 | $80,900 | $328,800 |
| 2019 | $6,391 | $375,300 | $80,900 | $294,400 |
| 2018 | $6,481 | $375,300 | $80,900 | $294,400 |
| 2017 | $6,459 | $383,300 | $77,600 | $305,700 |
| 2016 | $6,669 | $393,900 | $77,600 | $316,300 |
| 2015 | $5,869 | $371,700 | $77,600 | $294,100 |
| 2014 | $5,736 | $382,400 | $75,600 | $306,800 |
Source: Public Records
Map
Nearby Homes
Your Personal Tour Guide
Ask me questions while you tour the home.