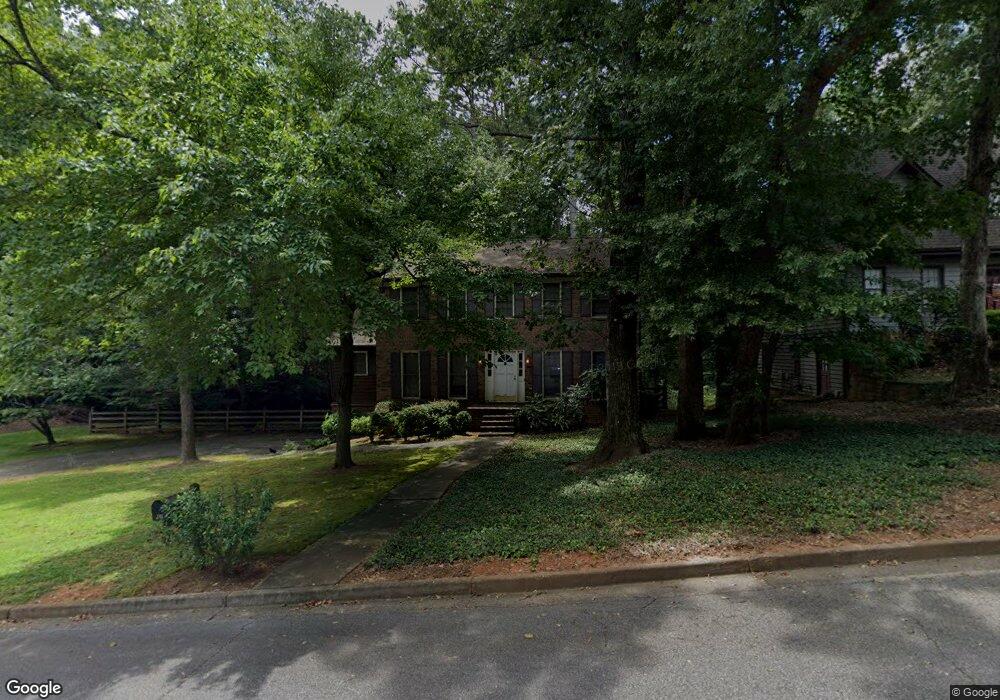
135 Sweetwood Way Unit 2 Roswell, GA 30076
Martin's Landing NeighborhoodEstimated Value: $514,000 - $584,000
4
Beds
3
Baths
2,405
Sq Ft
$230/Sq Ft
Est. Value
About This Home
This home is located at 135 Sweetwood Way Unit 2, Roswell, GA 30076 and is currently estimated at $554,115, approximately $230 per square foot. 135 Sweetwood Way Unit 2 is a home located in Fulton County with nearby schools including Jackson Elementary School, Holcomb Bridge Middle School, and Centennial High School.
Ownership History
Date
Name
Owned For
Owner Type
Purchase Details
Closed on
Nov 12, 2019
Sold by
Erven Anita
Bought by
Erven Christopher
Current Estimated Value
Purchase Details
Closed on
Feb 25, 2004
Sold by
Jackness Robert L
Bought by
Erven Anita and Erven Christopher
Home Financials for this Owner
Home Financials are based on the most recent Mortgage that was taken out on this home.
Original Mortgage
$208,050
Interest Rate
5.25%
Mortgage Type
New Conventional
Purchase Details
Closed on
Jun 1, 1998
Sold by
Jackson Birdel F and Jackson Edith D
Bought by
Jackness Robert L
Home Financials for this Owner
Home Financials are based on the most recent Mortgage that was taken out on this home.
Original Mortgage
$149,300
Interest Rate
7.15%
Mortgage Type
New Conventional
Create a Home Valuation Report for This Property
The Home Valuation Report is an in-depth analysis detailing your home's value as well as a comparison with similar homes in the area
Home Values in the Area
Average Home Value in this Area
Purchase History
| Date | Buyer | Sale Price | Title Company |
|---|---|---|---|
| Erven Christopher | -- | -- | |
| Erven Anita | $219,000 | -- | |
| Jackness Robert L | $165,900 | -- |
Source: Public Records
Mortgage History
| Date | Status | Borrower | Loan Amount |
|---|---|---|---|
| Previous Owner | Erven Anita | $208,050 | |
| Previous Owner | Jackness Robert L | $149,300 |
Source: Public Records
Tax History Compared to Growth
Tax History
| Year | Tax Paid | Tax Assessment Tax Assessment Total Assessment is a certain percentage of the fair market value that is determined by local assessors to be the total taxable value of land and additions on the property. | Land | Improvement |
|---|---|---|---|---|
| 2025 | $518 | $179,560 | $35,680 | $143,880 |
| 2023 | $4,590 | $162,600 | $48,600 | $114,000 |
| 2022 | $2,133 | $146,000 | $29,560 | $116,440 |
| 2021 | $2,514 | $125,000 | $24,920 | $100,080 |
| 2020 | $2,556 | $123,520 | $24,600 | $98,920 |
| 2019 | $404 | $114,160 | $23,440 | $90,720 |
| 2018 | $2,669 | $111,520 | $22,920 | $88,600 |
| 2017 | $1,884 | $76,520 | $15,720 | $60,800 |
| 2016 | $1,883 | $76,520 | $15,720 | $60,800 |
| 2015 | $2,308 | $76,520 | $15,720 | $60,800 |
| 2014 | $1,955 | $76,520 | $15,720 | $60,800 |
Source: Public Records
Map
Nearby Homes
- 9470 Hillside Dr
- 130 Lakeview Ridge W
- 1045 Martin Ridge Rd
- 645 Trailmore Place
- 230 Lakeview Ridge E
- 2020 Rivermont Way
- 1265 Northshore Dr
- 300 Cedar Knoll Ct
- 324 Teal Ct
- 1140 Northshore Dr
- 150 N Pond Ct Unit 1
- 406 Teal Ct
- 227 Quail Run
- 125 N Pond Way
- 263 Quail Run
- 309 Quail Run
- 311 Quail Run
- 225 Winterberry Ct
- 230 Winterberry Ct
- 2046 Heathermere Way
- 125 Sweetwood Way
- 130 Sweetwood Way
- 115 Sweetwood Way
- 140 Sweetwood Way
- 1015 Trailmore Dr
- 1005 Trailmore Dr Unit 2/1
- 1005 Trailmore Dr
- 160 Sweetwood Way
- 15 Sweetwood Ct
- 120 Sweetwood Way
- 105 Sweetwood Way
- 0 Sweetwood Ct Unit 8876203
- 150 Sweetwood Way
- 25 Sweetwood Ct
- 20 Sweetwood Ct Unit 2
- 110 Sweetwood Way Unit 2
- 270 Martin Ridge Ct
- 2915 Cedar Knoll Dr Unit 2
- 35 Sweetwood Ct
- 280 Martin Ridge Ct