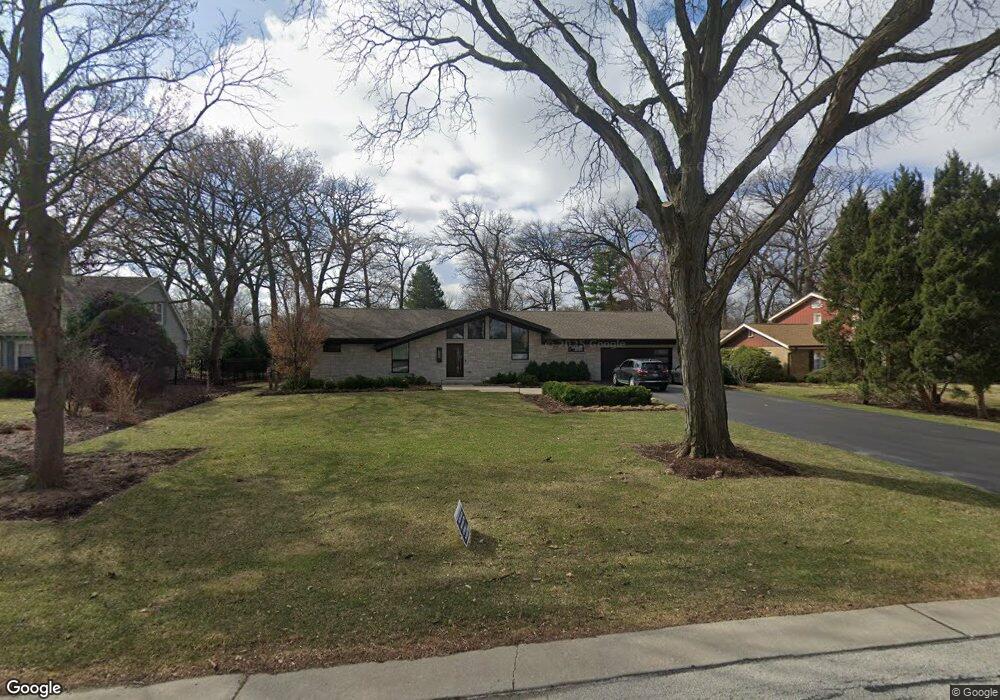
135 Timber View Dr Oak Brook, IL 60523
Estimated Value: $584,000 - $1,037,000
3
Beds
2
Baths
1,914
Sq Ft
$380/Sq Ft
Est. Value
About This Home
This home is located at 135 Timber View Dr, Oak Brook, IL 60523 and is currently estimated at $726,539, approximately $379 per square foot. 135 Timber View Dr is a home located in DuPage County with nearby schools including Salt Creek Elementary School, Stella May Swartz Elementary School, and John E Albright Middle School.
Ownership History
Date
Name
Owned For
Owner Type
Purchase Details
Closed on
Jun 20, 2017
Sold by
Gilbert James L
Bought by
The Scott R Rimkus Revocable Trust and The Ellen L Rimkus Revocable Trust
Current Estimated Value
Purchase Details
Closed on
Jul 9, 2001
Sold by
Dellaria Jon and Dellaria Gloria
Bought by
Gilbert James L
Home Financials for this Owner
Home Financials are based on the most recent Mortgage that was taken out on this home.
Original Mortgage
$315,000
Interest Rate
6.37%
Mortgage Type
Purchase Money Mortgage
Purchase Details
Closed on
Mar 25, 1998
Sold by
Beverly Trust Company
Bought by
Dellaria Jon and Dellaria Gloria
Home Financials for this Owner
Home Financials are based on the most recent Mortgage that was taken out on this home.
Original Mortgage
$73,000
Interest Rate
7.09%
Mortgage Type
Purchase Money Mortgage
Create a Home Valuation Report for This Property
The Home Valuation Report is an in-depth analysis detailing your home's value as well as a comparison with similar homes in the area
Home Values in the Area
Average Home Value in this Area
Purchase History
| Date | Buyer | Sale Price | Title Company |
|---|---|---|---|
| The Scott R Rimkus Revocable Trust | $425,000 | Attorney | |
| Gilbert James L | $375,000 | Chicago Title Insurance Co | |
| Dellaria Jon | -- | -- |
Source: Public Records
Mortgage History
| Date | Status | Borrower | Loan Amount |
|---|---|---|---|
| Previous Owner | Gilbert James L | $315,000 | |
| Previous Owner | Dellaria Jon | $73,000 |
Source: Public Records
Tax History Compared to Growth
Tax History
| Year | Tax Paid | Tax Assessment Tax Assessment Total Assessment is a certain percentage of the fair market value that is determined by local assessors to be the total taxable value of land and additions on the property. | Land | Improvement |
|---|---|---|---|---|
| 2024 | $8,452 | $191,040 | $103,739 | $87,301 |
| 2023 | $6,405 | $176,660 | $95,930 | $80,730 |
| 2022 | $6,009 | $169,830 | $92,220 | $77,610 |
| 2021 | $6,115 | $165,610 | $89,930 | $75,680 |
| 2020 | $6,009 | $161,980 | $87,960 | $74,020 |
| 2019 | $6,999 | $154,000 | $83,630 | $70,370 |
| 2018 | $7,064 | $150,020 | $79,160 | $70,860 |
| 2017 | $6,833 | $142,950 | $75,430 | $67,520 |
| 2016 | $6,117 | $134,670 | $71,060 | $63,610 |
| 2015 | $5,993 | $125,460 | $66,200 | $59,260 |
| 2014 | $6,486 | $131,990 | $80,620 | $51,370 |
| 2013 | $6,344 | $133,850 | $81,760 | $52,090 |
Source: Public Records
Map
Nearby Homes
- 175 W Brush Hill Rd Unit 404
- 1200 S Prospect Ave Unit 303
- 1200 S Prospect Ave Unit 108
- 274 Timber View Dr
- 130 Crab Apple Ln
- 2 S Atrium Way Unit 203
- 110 W Butterfield Rd Unit 502S
- 911 Red Fox Ln
- 601-1 Harger Rd
- 1S150 Spring Rd Unit 5B
- 1S150 Spring Rd Unit 4L
- 3 Oak Brook Club Dr Unit E207
- 1 Oak Brook Club Dr Unit A301
- 1 Oak Brook Club Dr Unit A312
- 963 S Saylor Ave
- 936 S Mitchell Ave
- 162 E Hale St
- 15W320 Concord St
- 900 S Colfax Ave
- 837 S Kearsage Ave
- 121 Timber View Dr
- 147 Timber View Dr
- 107 Timber View Dr
- 161 Timber View Dr
- 134 Green Leaf Dr
- 146 Green Leaf Dr
- 148 Timber View Dr Unit 1
- 122 Timber View Dr
- 136 Timber View Dr
- 101 Timber View Dr
- 120 Green Leaf Dr
- 175 Timber View Dr
- 108 Timber View Dr
- 106 Green Leaf Dr
- 142 Timber View Dr
- 158 Green Leaf Dr
- 67 Timber View Dr
- 170 Green Leaf Dr
- 170 Timber View Dr
- 187 Timber View Dr