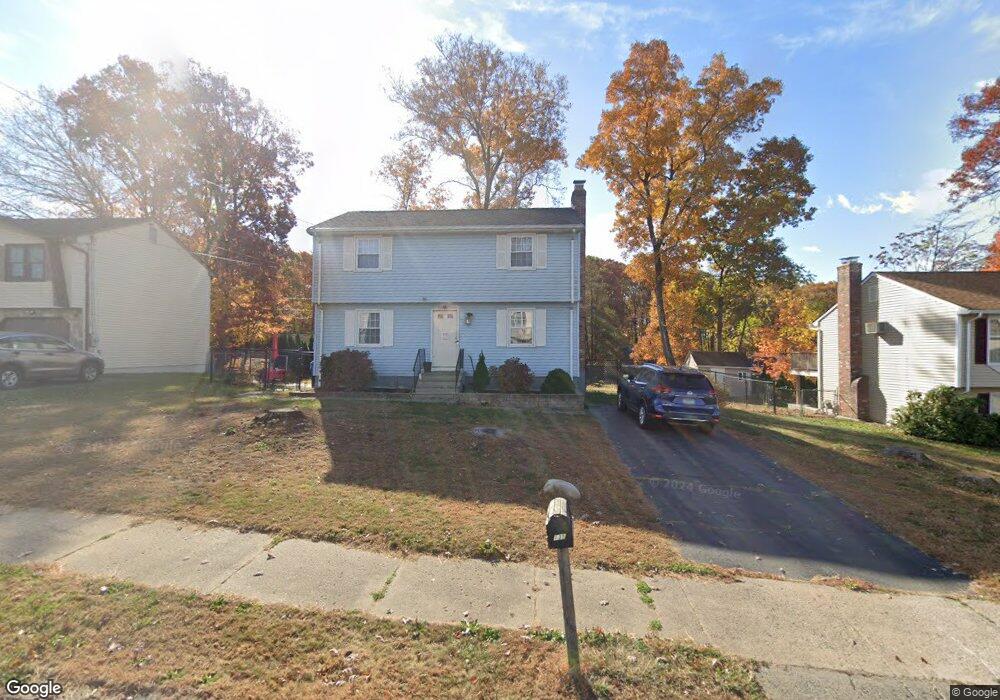
135 Torkom Dr New Britain, CT 06053
Estimated Value: $308,000 - $344,000
3
Beds
2
Baths
1,568
Sq Ft
$210/Sq Ft
Est. Value
About This Home
This home is located at 135 Torkom Dr, New Britain, CT 06053 and is currently estimated at $328,841, approximately $209 per square foot. 135 Torkom Dr is a home located in Hartford County with nearby schools including Gaffney School, Slade Middle School, and Mountain Laurel Sudbury School.
Ownership History
Date
Name
Owned For
Owner Type
Purchase Details
Closed on
Dec 22, 2006
Sold by
Sfjv Llc
Bought by
Rosario Wilma E
Current Estimated Value
Home Financials for this Owner
Home Financials are based on the most recent Mortgage that was taken out on this home.
Original Mortgage
$179,450
Interest Rate
6.35%
Purchase Details
Closed on
Oct 26, 2004
Sold by
Shafer Norman Lee and Shafer Brunhild
Bought by
Shafer Karla A
Home Financials for this Owner
Home Financials are based on the most recent Mortgage that was taken out on this home.
Original Mortgage
$177,219
Interest Rate
5.85%
Create a Home Valuation Report for This Property
The Home Valuation Report is an in-depth analysis detailing your home's value as well as a comparison with similar homes in the area
Home Values in the Area
Average Home Value in this Area
Purchase History
| Date | Buyer | Sale Price | Title Company |
|---|---|---|---|
| Rosario Wilma E | $185,000 | -- | |
| Shafer Karla A | $180,000 | -- |
Source: Public Records
Mortgage History
| Date | Status | Borrower | Loan Amount |
|---|---|---|---|
| Open | Shafer Karla A | $162,120 | |
| Closed | Shafer Karla A | $179,450 | |
| Previous Owner | Shafer Karla A | $177,219 |
Source: Public Records
Tax History Compared to Growth
Tax History
| Year | Tax Paid | Tax Assessment Tax Assessment Total Assessment is a certain percentage of the fair market value that is determined by local assessors to be the total taxable value of land and additions on the property. | Land | Improvement |
|---|---|---|---|---|
| 2025 | $7,032 | $179,480 | $63,420 | $116,060 |
| 2024 | $7,106 | $179,480 | $63,420 | $116,060 |
| 2023 | $6,870 | $179,480 | $63,420 | $116,060 |
| 2022 | $5,814 | $117,460 | $29,190 | $88,270 |
| 2021 | $5,814 | $117,460 | $29,190 | $88,270 |
| 2020 | $5,932 | $117,460 | $29,190 | $88,270 |
| 2019 | $5,932 | $117,460 | $29,190 | $88,270 |
| 2018 | $5,932 | $117,460 | $29,190 | $88,270 |
| 2017 | $5,769 | $114,240 | $24,360 | $89,880 |
| 2016 | $5,769 | $114,240 | $24,360 | $89,880 |
| 2015 | $5,598 | $114,240 | $24,360 | $89,880 |
| 2014 | $5,598 | $114,240 | $24,360 | $89,880 |
Source: Public Records
Map
Nearby Homes
- 115 Beechwood Dr
- 42 Fairlane Dr
- 23 Ledyard Rd
- 108 Overhill Ave
- 817 W Main St
- 1467 Corbin Ave
- 76 N Mountain Rd Unit B
- 1485 Corbin Ave
- 80 N Mountain Rd Unit B
- 230 Hillhurst Ave
- 87 Pinehurst Ave
- 33 Colt St
- 30 Westerly St
- 149 Pennsylvania Ave Unit 151
- 43 Westerly St
- 106 Barnes St
- 71 Pennsylvania Ave
- 19 Maplehurst Ave
- 8 Albany Ave
- 25 Clinton St