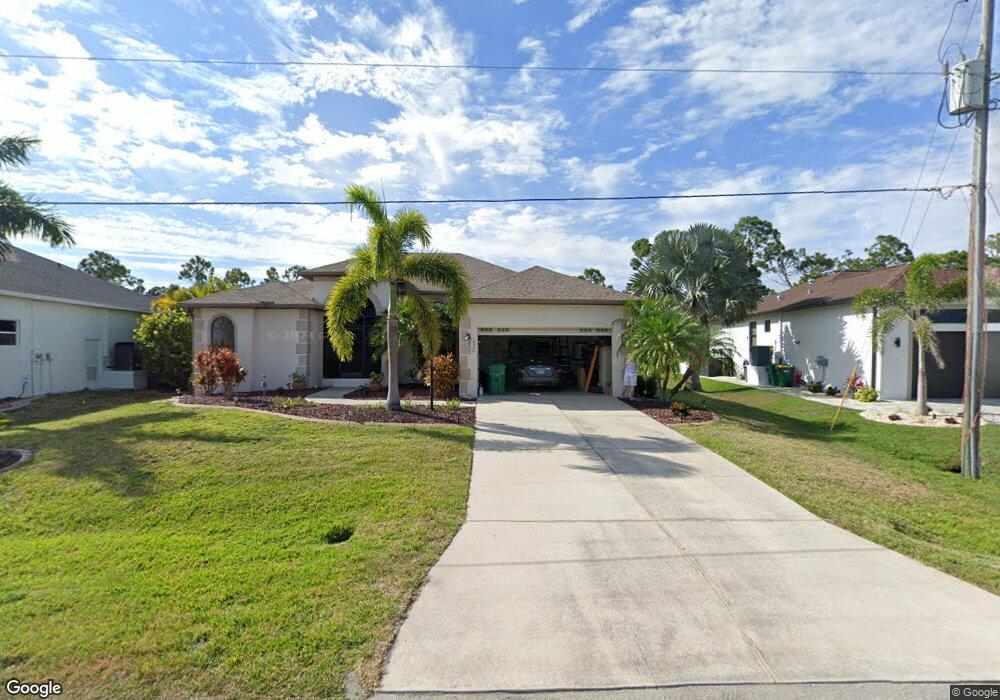
135 White Marsh Ln Rotonda West, FL 33947
Estimated Value: $419,017 - $499,000
3
Beds
2
Baths
2,052
Sq Ft
$221/Sq Ft
Est. Value
About This Home
This home is located at 135 White Marsh Ln, Rotonda West, FL 33947 and is currently estimated at $454,254, approximately $221 per square foot. 135 White Marsh Ln is a home located in Charlotte County with nearby schools including Vineland Elementary School, L.A. Ainger Middle School, and Lemon Bay High School.
Ownership History
Date
Name
Owned For
Owner Type
Purchase Details
Closed on
Dec 29, 2009
Sold by
Wells Fargo Bank N A
Bought by
Miller Albert
Current Estimated Value
Purchase Details
Closed on
Dec 21, 2009
Sold by
Montgomery Douglas A and Montgomery Tammy L
Bought by
Gmac Mortgage Llc
Purchase Details
Closed on
Jun 7, 2006
Sold by
Waterford Construction Inc
Bought by
Montgomery Douglas A and Montgomery Tammy L
Home Financials for this Owner
Home Financials are based on the most recent Mortgage that was taken out on this home.
Original Mortgage
$340,250
Interest Rate
2.45%
Mortgage Type
Fannie Mae Freddie Mac
Purchase Details
Closed on
Jan 13, 2005
Sold by
Equity Trust Co
Bought by
Waterford Construction Inc
Purchase Details
Closed on
May 14, 2004
Sold by
Kasper John and Kasper Deborah
Bought by
Equity Trust Co and Kathleen Doucette Ira
Create a Home Valuation Report for This Property
The Home Valuation Report is an in-depth analysis detailing your home's value as well as a comparison with similar homes in the area
Home Values in the Area
Average Home Value in this Area
Purchase History
| Date | Buyer | Sale Price | Title Company |
|---|---|---|---|
| Miller Albert | $160,000 | Attorney | |
| Wells Fargo Bank N A | -- | Attorney | |
| Gmac Mortgage Llc | $166,300 | Attorney | |
| Montgomery Douglas A | $378,100 | North American Title Co | |
| Waterford Construction Inc | $60,000 | -- | |
| Equity Trust Co | $34,000 | -- |
Source: Public Records
Mortgage History
| Date | Status | Borrower | Loan Amount |
|---|---|---|---|
| Previous Owner | Montgomery Douglas A | $340,250 |
Source: Public Records
Tax History Compared to Growth
Tax History
| Year | Tax Paid | Tax Assessment Tax Assessment Total Assessment is a certain percentage of the fair market value that is determined by local assessors to be the total taxable value of land and additions on the property. | Land | Improvement |
|---|---|---|---|---|
| 2023 | $4,522 | $260,067 | $0 | $0 |
| 2022 | $4,388 | $252,492 | $0 | $0 |
| 2021 | $4,379 | $245,138 | $16,150 | $228,988 |
| 2020 | $4,428 | $259,669 | $15,300 | $244,369 |
| 2019 | $4,146 | $254,798 | $17,850 | $236,948 |
| 2018 | $4,390 | $241,597 | $17,850 | $223,747 |
| 2017 | $4,169 | $224,800 | $17,850 | $206,950 |
| 2016 | $4,189 | $221,729 | $0 | $0 |
| 2015 | $3,928 | $204,430 | $0 | $0 |
| 2014 | $3,903 | $202,103 | $0 | $0 |
Source: Public Records
Map
Nearby Homes
- 143 White Marsh Ln
- 127 White Marsh Ln
- 168 Rotonda Blvd E
- 148 Medalist Rd
- 174 Long Meadow Ln
- 171 Medalist Rd
- 150 Marker Rd
- 89 White Marsh
- 167 Marker Rd
- 17 Medalist Way
- 116 Tournament Rd
- 15 Medalist Way
- 9 Medalist Terrace
- 13 Medalist Way
- 22 Medalist Terrace
- 18 Medalist Terrace
- 12 Medalist Terrace
- 79 Medalist Rd
- 95 & 97 Tournament Rd
- 75 Medalist Rd
- 137 White Marsh Ln
- 134 White Marsh Ln
- 139 White Marsh Ln
- 131 White Marsh Ln
- 132 White Marsh Ln
- 136 White Marsh Ln
- 141 White Marsh Ln
- 130 White Marsh Ln
- 129 White Marsh Ln
- 138 White Marsh Ln
- 128 White Marsh Ln
- 140 White Marsh Ln
- 126 White Marsh Ln
- 145 White Marsh Ln
- 125 White Marsh Ln
- 129 Medalist Rd
- 131 Medalist Rd
- 127 Medalist Rd
- 166 Rotonda Blvd E
- 125 Medalist Rd