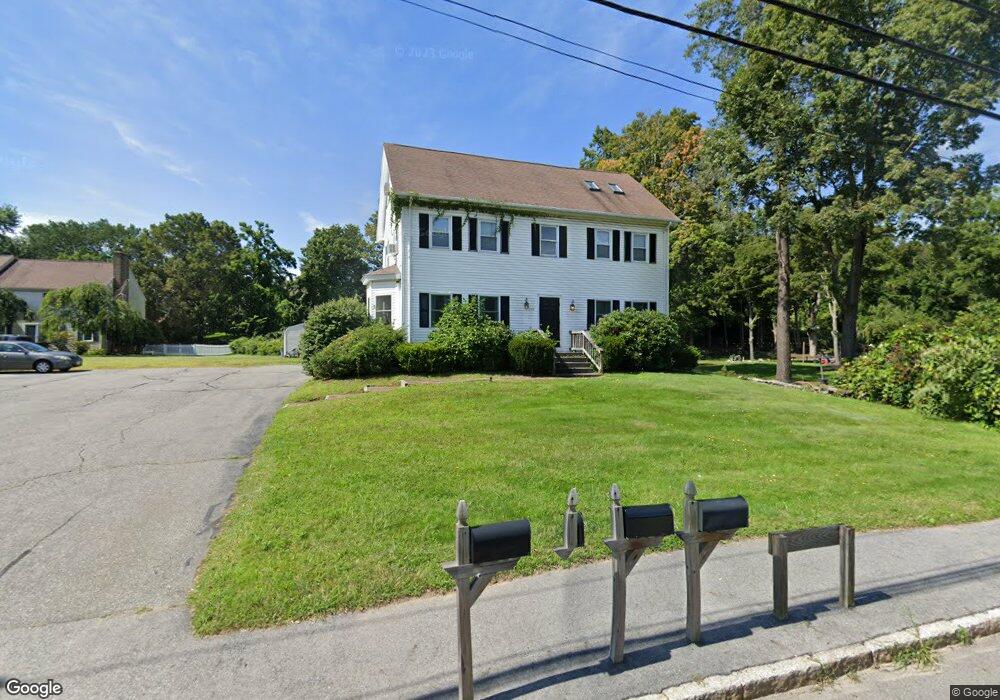
135 Worcester St Unit 1 North Grafton, MA 01536
Estimated Value: $298,000 - $397,000
2
Beds
1
Bath
1,143
Sq Ft
$308/Sq Ft
Est. Value
About This Home
This home is located at 135 Worcester St Unit 1, North Grafton, MA 01536 and is currently estimated at $351,533, approximately $307 per square foot. 135 Worcester St Unit 1 is a home located in Worcester County with nearby schools including Grafton High School, Silver Spruce Montessori School, and Al-Hamra Academy.
Ownership History
Date
Name
Owned For
Owner Type
Purchase Details
Closed on
Jan 30, 2003
Sold by
Magliaro Steven J and Magliaro Elizabeth
Bought by
Destefano Monica N
Current Estimated Value
Home Financials for this Owner
Home Financials are based on the most recent Mortgage that was taken out on this home.
Original Mortgage
$91,000
Interest Rate
6.09%
Mortgage Type
Purchase Money Mortgage
Purchase Details
Closed on
Mar 29, 2001
Sold by
Cassinari Douglas I and Cassinari Lisa S
Bought by
May Christopher D
Home Financials for this Owner
Home Financials are based on the most recent Mortgage that was taken out on this home.
Original Mortgage
$113,900
Interest Rate
6.96%
Mortgage Type
Purchase Money Mortgage
Purchase Details
Closed on
Sep 1, 2000
Sold by
Lynch Gregory G and Lynch Jeanne B
Bought by
Magliaro Steven
Purchase Details
Closed on
Sep 29, 1993
Sold by
Wiegel Michael D and Wiegel Cheryl
Bought by
Lynch Greogry G and Lynch Jeanne B
Create a Home Valuation Report for This Property
The Home Valuation Report is an in-depth analysis detailing your home's value as well as a comparison with similar homes in the area
Home Values in the Area
Average Home Value in this Area
Purchase History
| Date | Buyer | Sale Price | Title Company |
|---|---|---|---|
| Destefano Monica N | $166,000 | -- | |
| May Christopher D | $119,900 | -- | |
| Magliaro Steven | $95,000 | -- | |
| Lynch Greogry G | $84,000 | -- |
Source: Public Records
Mortgage History
| Date | Status | Borrower | Loan Amount |
|---|---|---|---|
| Open | Lynch Greogry G | $80,000 | |
| Closed | Lynch Greogry G | $91,000 | |
| Previous Owner | Lynch Greogry G | $113,900 |
Source: Public Records
Tax History Compared to Growth
Tax History
| Year | Tax Paid | Tax Assessment Tax Assessment Total Assessment is a certain percentage of the fair market value that is determined by local assessors to be the total taxable value of land and additions on the property. | Land | Improvement |
|---|---|---|---|---|
| 2025 | $3,853 | $276,400 | $0 | $276,400 |
| 2024 | $3,772 | $263,600 | $0 | $263,600 |
| 2023 | $3,627 | $230,900 | $0 | $230,900 |
| 2022 | $3,444 | $204,000 | $0 | $204,000 |
| 2021 | $3,426 | $199,400 | $0 | $199,400 |
| 2020 | $3,102 | $188,000 | $0 | $188,000 |
| 2019 | $3,132 | $188,000 | $0 | $188,000 |
| 2018 | $2,980 | $179,600 | $0 | $179,600 |
| 2017 | $3,460 | $211,000 | $0 | $211,000 |
| 2016 | $3,494 | $208,600 | $0 | $208,600 |
| 2015 | $3,351 | $203,100 | $0 | $203,100 |
| 2014 | $3,099 | $203,100 | $0 | $203,100 |
Source: Public Records
Map
Nearby Homes
- 44 Meadow Ln
- 3 Abby Rd
- 17 Hingham Rd
- 14 Northgate Ct Unit 14
- 11 Hovey Pond Dr Unit 11
- 7 Hovey Pond Dr Unit 7
- 194 Worcester St
- 0 East St
- 1 Doris Dr
- 9 Logan Path
- 22 Beverly Rd
- 156 Brigham Hill Rd
- 4 Winslow Ln Unit 1410
- 55 Carroll Rd
- 11 1/2 Carroll Rd Unit B
- 14 Indian Path
- 76 Samuel Dr
- 4 Abby Rd
- 5 Lincoln Ln Unit 5
- 21 Lordvale Blvd Unit 406
- 135 Worcester St Unit 3
- 135 Worcester St Unit 2
- 135 Worcester St Unit 2
- 133 Worcester St Unit 2
- 133 Worcester St Unit 1
- 133 Worcester St Unit 133A
- 133 Worcester St Unit 2
- 133 Worcester St Unit 1
- 130 Worcester St Route 122
- 130 Worcester St
- 137 Worcester St
- 137 Worcester St
- 20 Meadow Ln
- 18 Meadow Ln
- 131 Worcester St
- 16 Meadow Ln
- 22 Meadow Ln
- 16 Meadow Lane L-22
- 126 Worcester St
- 127 Worcester St