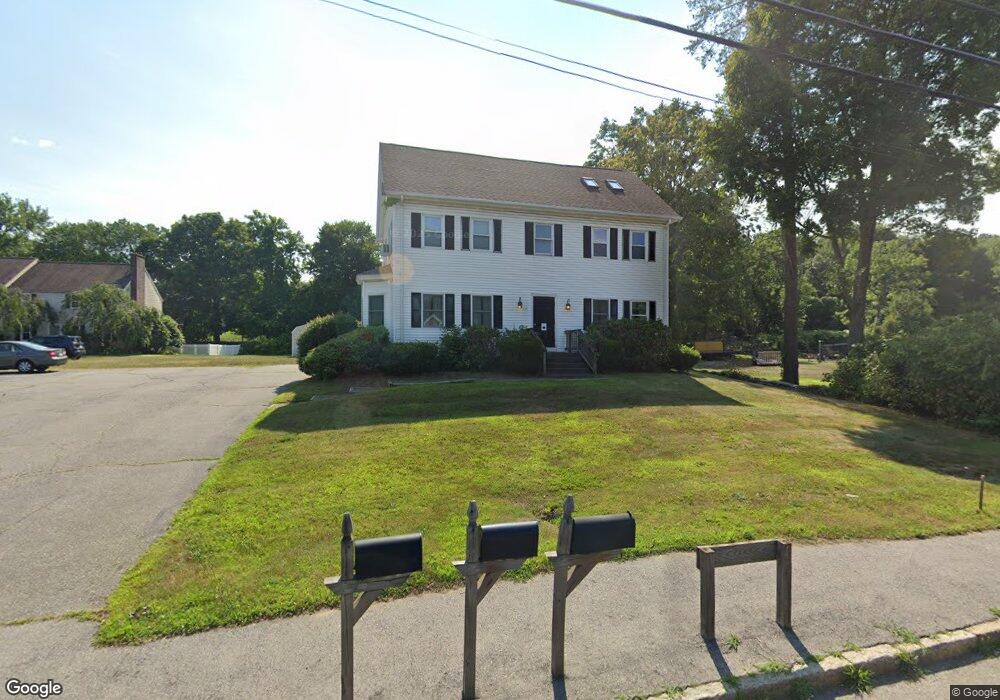
135 Worcester St Unit 2 North Grafton, MA 01536
Estimated Value: $263,000 - $391,000
2
Beds
1
Bath
1,300
Sq Ft
$238/Sq Ft
Est. Value
About This Home
This home is located at 135 Worcester St Unit 2, North Grafton, MA 01536 and is currently estimated at $309,878, approximately $238 per square foot. 135 Worcester St Unit 2 is a home located in Worcester County with nearby schools including Grafton High School, Silver Spruce Montessori School, and Al-Hamra Academy.
Ownership History
Date
Name
Owned For
Owner Type
Purchase Details
Closed on
Jul 9, 2022
Sold by
Chang Serena
Bought by
Saeed Farah
Current Estimated Value
Purchase Details
Closed on
Oct 6, 2003
Sold by
May Christopher
Bought by
Change Serena and Chang Serena S
Home Financials for this Owner
Home Financials are based on the most recent Mortgage that was taken out on this home.
Original Mortgage
$134,000
Interest Rate
6.25%
Mortgage Type
Purchase Money Mortgage
Purchase Details
Closed on
Jun 2, 1997
Sold by
Burke Mary C and Mayo Nancy E
Bought by
Cassinari Douglas I and Sayess Lisa S
Home Financials for this Owner
Home Financials are based on the most recent Mortgage that was taken out on this home.
Original Mortgage
$59,600
Interest Rate
8.09%
Mortgage Type
Purchase Money Mortgage
Create a Home Valuation Report for This Property
The Home Valuation Report is an in-depth analysis detailing your home's value as well as a comparison with similar homes in the area
Home Values in the Area
Average Home Value in this Area
Purchase History
| Date | Buyer | Sale Price | Title Company |
|---|---|---|---|
| Saeed Farah | $212,500 | None Available | |
| Change Serena | $167,500 | -- | |
| Cassinari Douglas I | $62,750 | -- |
Source: Public Records
Mortgage History
| Date | Status | Borrower | Loan Amount |
|---|---|---|---|
| Previous Owner | Change Serena | $134,000 | |
| Previous Owner | Cassinari Douglas I | $114,000 | |
| Previous Owner | Cassinari Douglas I | $59,600 | |
| Previous Owner | Cassinari Douglas I | $67,200 |
Source: Public Records
Tax History Compared to Growth
Tax History
| Year | Tax Paid | Tax Assessment Tax Assessment Total Assessment is a certain percentage of the fair market value that is determined by local assessors to be the total taxable value of land and additions on the property. | Land | Improvement |
|---|---|---|---|---|
| 2025 | $3,240 | $232,400 | $0 | $232,400 |
| 2024 | $3,157 | $220,600 | $0 | $220,600 |
| 2023 | $3,021 | $192,300 | $0 | $192,300 |
| 2022 | $2,854 | $169,100 | $0 | $169,100 |
| 2021 | $2,835 | $165,000 | $0 | $165,000 |
| 2020 | $2,556 | $154,900 | $0 | $154,900 |
| 2019 | $2,581 | $154,900 | $0 | $154,900 |
| 2018 | $2,420 | $145,900 | $0 | $145,900 |
| 2017 | $2,344 | $142,900 | $0 | $142,900 |
| 2016 | $2,318 | $138,400 | $0 | $138,400 |
| 2015 | $2,221 | $134,600 | $0 | $134,600 |
| 2014 | $2,054 | $134,600 | $0 | $134,600 |
Source: Public Records
Map
Nearby Homes
- 3 Abby Rd
- 167 Worcester St
- 17 Hingham Rd
- 6 Overlook St
- 14 Northgate Ct Unit 14
- 194 Worcester St
- 0 East St
- 1 Doris Dr
- 9 Logan Path
- 156 Brigham Hill Rd
- 4 Abby Rd
- 5 Lincoln Ln Unit 5
- 23 Institute Rd
- 25 Clearview St
- 8 Hudson Ave
- 51 John Dr Unit 51
- 16 Clearview St
- 46 John Dr Unit 46
- 72 Westborough Rd Unit 1
- 72 Westborough Rd Unit 2
- 135 Worcester St Unit 3
- 135 Worcester St Unit 2
- 135 Worcester St Unit 1
- 133 Worcester St Unit 2
- 133 Worcester St Unit 1
- 133 Worcester St Unit 133A
- 133 Worcester St Unit 2
- 133 Worcester St Unit 1
- 130 Worcester St Route 122
- 130 Worcester St
- 137 Worcester St
- 137 Worcester St
- 20 Meadow Ln
- 18 Meadow Ln
- 131 Worcester St
- 16 Meadow Ln
- 22 Meadow Ln
- 16 Meadow Lane L-22
- 126 Worcester St
- 127 Worcester St