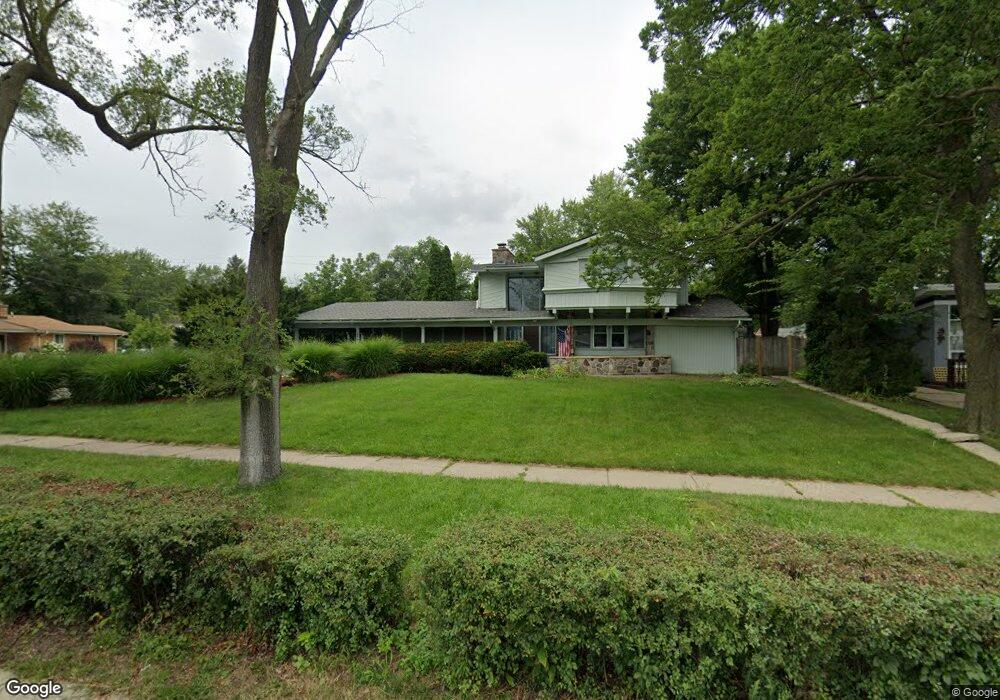
1350 Birch Rd Homewood, IL 60430
Estimated Value: $283,000 - $328,000
3
Beds
3
Baths
2,600
Sq Ft
$116/Sq Ft
Est. Value
About This Home
This home is located at 1350 Birch Rd, Homewood, IL 60430 and is currently estimated at $302,480, approximately $116 per square foot. 1350 Birch Rd is a home located in Cook County with nearby schools including Willow Elementary School, Winston Churchill School, and James Hart School.
Ownership History
Date
Name
Owned For
Owner Type
Purchase Details
Closed on
Nov 29, 2015
Sold by
Secretary Of Housing & Urban Development
Bought by
Lenoir Thomas G
Current Estimated Value
Home Financials for this Owner
Home Financials are based on the most recent Mortgage that was taken out on this home.
Original Mortgage
$164,898
Outstanding Balance
$133,079
Interest Rate
4.5%
Mortgage Type
FHA
Estimated Equity
$169,401
Purchase Details
Closed on
Sep 25, 2014
Sold by
Russell Levern A and Wilson Russell Lorna D
Bought by
Secretary Of Housing & Urban Development
Purchase Details
Closed on
Oct 6, 2010
Sold by
Shore Stuart and Shore Sandra
Bought by
Russell Le Vern and Wilson Russell Lorna
Home Financials for this Owner
Home Financials are based on the most recent Mortgage that was taken out on this home.
Original Mortgage
$262,218
Interest Rate
4.3%
Mortgage Type
FHA
Create a Home Valuation Report for This Property
The Home Valuation Report is an in-depth analysis detailing your home's value as well as a comparison with similar homes in the area
Home Values in the Area
Average Home Value in this Area
Purchase History
| Date | Buyer | Sale Price | Title Company |
|---|---|---|---|
| Lenoir Thomas G | $119,500 | Git | |
| Secretary Of Housing & Urban Development | -- | None Available | |
| Russell Le Vern | $237,000 | Bt |
Source: Public Records
Mortgage History
| Date | Status | Borrower | Loan Amount |
|---|---|---|---|
| Open | Lenoir Thomas G | $164,898 | |
| Previous Owner | Russell Le Vern | $262,218 |
Source: Public Records
Tax History Compared to Growth
Tax History
| Year | Tax Paid | Tax Assessment Tax Assessment Total Assessment is a certain percentage of the fair market value that is determined by local assessors to be the total taxable value of land and additions on the property. | Land | Improvement |
|---|---|---|---|---|
| 2024 | $4,894 | $13,500 | $3,350 | $10,150 |
| 2023 | $4,224 | $13,500 | $3,350 | $10,150 |
| 2022 | $4,224 | $9,876 | $2,848 | $7,028 |
| 2021 | $3,960 | $9,874 | $2,847 | $7,027 |
| 2020 | $3,901 | $9,874 | $2,847 | $7,027 |
| 2019 | $4,001 | $9,952 | $2,512 | $7,440 |
| 2018 | $3,869 | $9,952 | $2,512 | $7,440 |
| 2017 | $3,893 | $9,952 | $2,512 | $7,440 |
| 2016 | $3,876 | $9,288 | $2,345 | $6,943 |
| 2015 | $3,818 | $9,288 | $2,345 | $6,943 |
| 2014 | $3,759 | $9,288 | $2,345 | $6,943 |
| 2013 | $3,832 | $10,182 | $2,345 | $7,837 |
Source: Public Records
Map
Nearby Homes
- 1431 Willow Rd
- 1250 Olive Rd
- 18524 Lyn Ct
- 1607 183rd St
- 1617 183rd St
- 1120 183rd St
- 18524 Center Ave
- 18439 Marshfield Ave
- 1115 Birch Rd
- 18548 Lyn Ct
- 1121 Olive Rd
- 1118 185th St
- 18110 Center Ave
- 1655 183rd St
- 18350 Carpenter St
- 1214 Ridge Rd
- 18623 Marshfield Ave
- 1334 Linden Rd
- 18504 Carpenter St
- 1741 Evergreen Rd
- 1350 Birch Rd
- 1346 Birch Rd
- 1345 Evergreen Rd
- 1351 Evergreen Rd
- 1340 Birch Rd
- 1340 Birch Rd
- 1341 Evergreen Rd
- 18360 Loomis Ave
- 1331 Evergreen Rd
- 1341 Birch Rd
- 1327 Birch Rd
- 1338 Birch Rd
- 18328 Loomis Ave
- 1406 Birch Rd
- 1351 Birch Rd
- 1321 Birch Rd
- 1323 Evergreen Rd
- 1401 Birch Rd
- 1410 Birch Rd
- 1317 Birch Rd