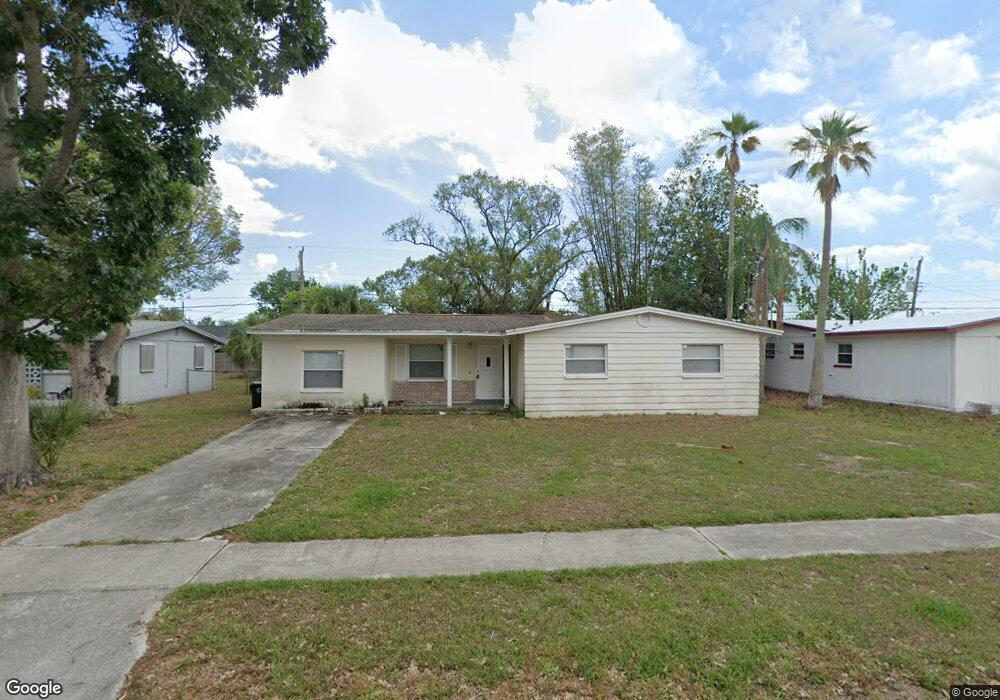
1350 Estridge Dr Rockledge, FL 32955
Estimated Value: $256,606 - $311,000
3
Beds
2
Baths
1,360
Sq Ft
$214/Sq Ft
Est. Value
About This Home
This home is located at 1350 Estridge Dr, Rockledge, FL 32955 and is currently estimated at $291,152, approximately $214 per square foot. 1350 Estridge Dr is a home located in Brevard County with nearby schools including Golfview Elementary School, Ronald McNair Magnet Middle School, and Rockledge Senior High School.
Ownership History
Date
Name
Owned For
Owner Type
Purchase Details
Closed on
Aug 22, 1997
Sold by
Veterans Affairs
Bought by
Venable Barbara K
Current Estimated Value
Home Financials for this Owner
Home Financials are based on the most recent Mortgage that was taken out on this home.
Original Mortgage
$55,697
Outstanding Balance
$8,334
Interest Rate
7.52%
Estimated Equity
$282,818
Purchase Details
Closed on
May 9, 1997
Sold by
Clerk Circuit Court
Bought by
Veterans Affairs
Purchase Details
Closed on
Apr 29, 1997
Sold by
Clerk Circuit Court
Bought by
Veterans Affairs
Purchase Details
Closed on
Mar 28, 1994
Sold by
Winner William P and Winner Leslie P
Bought by
Montgomery Murice W and Montgomery Buffy Marie E
Home Financials for this Owner
Home Financials are based on the most recent Mortgage that was taken out on this home.
Original Mortgage
$64,890
Interest Rate
7.2%
Create a Home Valuation Report for This Property
The Home Valuation Report is an in-depth analysis detailing your home's value as well as a comparison with similar homes in the area
Home Values in the Area
Average Home Value in this Area
Purchase History
| Date | Buyer | Sale Price | Title Company |
|---|---|---|---|
| Venable Barbara K | $60,100 | -- | |
| Veterans Affairs | -- | -- | |
| Veterans Affairs | -- | -- | |
| Montgomery Murice W | $63,000 | -- |
Source: Public Records
Mortgage History
| Date | Status | Borrower | Loan Amount |
|---|---|---|---|
| Open | Venable Barbara K | $55,697 | |
| Previous Owner | Montgomery Murice W | $64,890 |
Source: Public Records
Tax History Compared to Growth
Tax History
| Year | Tax Paid | Tax Assessment Tax Assessment Total Assessment is a certain percentage of the fair market value that is determined by local assessors to be the total taxable value of land and additions on the property. | Land | Improvement |
|---|---|---|---|---|
| 2025 | $2,737 | $208,540 | -- | -- |
| 2024 | $2,675 | $212,680 | -- | -- |
| 2023 | $2,675 | $212,960 | -- | -- |
| 2022 | $2,195 | $168,400 | $0 | $0 |
| 2021 | $1,956 | $126,260 | $35,000 | $91,260 |
| 2020 | $1,703 | $95,650 | $30,000 | $65,650 |
| 2019 | $1,679 | $101,570 | $30,000 | $71,570 |
| 2018 | $1,557 | $90,040 | $23,000 | $67,040 |
| 2017 | $1,449 | $79,250 | $23,000 | $56,250 |
| 2016 | $1,381 | $73,700 | $17,500 | $56,200 |
| 2015 | $1,291 | $58,980 | $17,500 | $41,480 |
| 2014 | $1,108 | $53,620 | $15,000 | $38,620 |
Source: Public Records
Map
Nearby Homes
- 981 Palmer St
- 1337 Briarwood Ct
- 1308 Woodingham Dr
- 994 Palmer St
- 1413 Floyd Dr
- 1420 Huntington Ln Unit 2105
- 1420 Huntington Ln Unit 2502
- 1420 Huntington Ln Unit 2101
- 1420 Huntington Ln Unit 2304
- 1420 Huntington Ln Unit 2405
- 1410 Huntington Ln Unit 1106
- 1410 Huntington Ln Unit 1203
- 1515 Huntington Ln Unit 922
- 1515 Huntington Ln Unit 924
- 1515 Huntington Ln Unit 227
- 1515 Huntington Ln Unit 427
- 1515 Huntington Ln Unit 223
- 1515 Huntington Ln Unit 426
- 1515 Huntington Ln Unit 626
- 1221 Saint Andrews Dr
- 1352 Estridge Dr
- 1348 Estridge Dr
- 1325 Canterbury Ln
- 1349 Estridge Dr
- 1346 Estridge Dr
- 1354 Estridge Dr
- 1329 Canterbury Ln
- 1347 Estridge Dr
- 1323 Canterbury Ln
- 971 Palmer St
- 1345 Estridge Dr
- 1331 Canterbury Ln
- 1344 Estridge Dr
- 1366 Estridge Dr
- 972 Palmer St
- 1321 Canterbury Ln
- 1343 Estridge Dr
- 1324 Canterbury Ln
- 1365 Estridge Dr
- 1333 Canterbury Ln