Estimated Value: $154,000 - $175,000
4
Beds
2
Baths
1,188
Sq Ft
$140/Sq Ft
Est. Value
About This Home
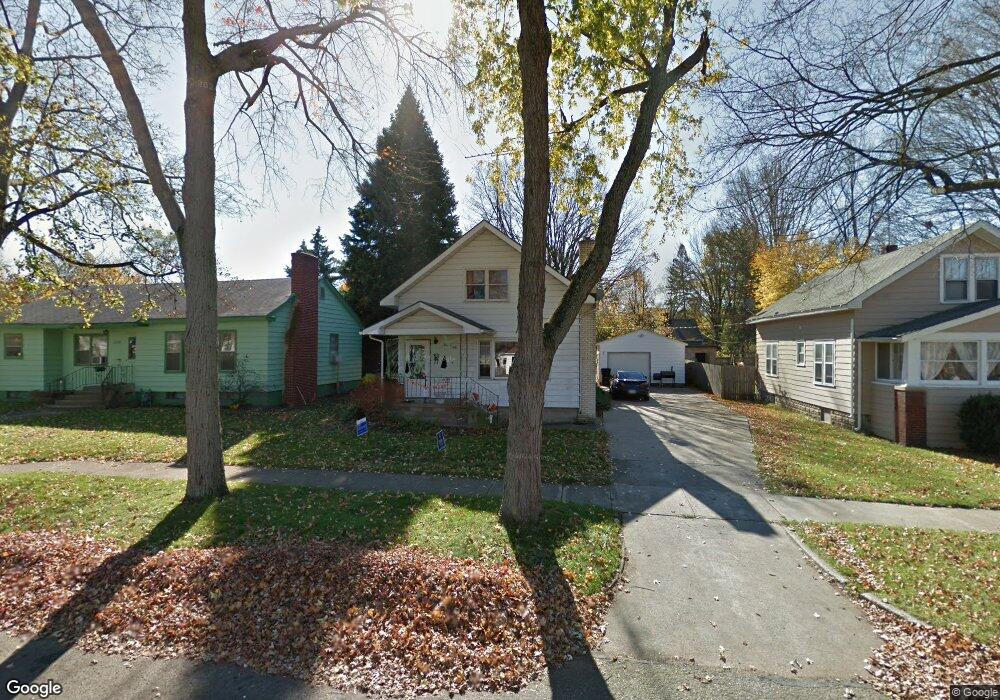
This home is located at 1350 Ferry St, Niles, MI 49120 and is currently estimated at $166,377, approximately $140 per square foot. 1350 Ferry St is a home located in Berrien County with nearby schools including Ballard Elementary School, Ring Lardner Middle School, and Oak Manor Sixth Grade Center.
Ownership History
Date
Name
Owned For
Owner Type
Purchase Details
Closed on
Oct 11, 2023
Sold by
Keller Todd A
Bought by
Keller Linda M
Current Estimated Value
Home Financials for this Owner
Home Financials are based on the most recent Mortgage that was taken out on this home.
Original Mortgage
$112,800
Outstanding Balance
$110,535
Interest Rate
7.25%
Mortgage Type
New Conventional
Estimated Equity
$55,842
Purchase Details
Closed on
Oct 10, 2023
Sold by
Keller Todd A
Bought by
Keller Linda M
Home Financials for this Owner
Home Financials are based on the most recent Mortgage that was taken out on this home.
Original Mortgage
$112,800
Outstanding Balance
$110,535
Interest Rate
7.25%
Mortgage Type
New Conventional
Estimated Equity
$55,842
Purchase Details
Closed on
Oct 25, 2002
Purchase Details
Closed on
Jan 30, 1990
Purchase Details
Closed on
Aug 16, 1989
Create a Home Valuation Report for This Property
The Home Valuation Report is an in-depth analysis detailing your home's value as well as a comparison with similar homes in the area
Home Values in the Area
Average Home Value in this Area
Purchase History
| Date | Buyer | Sale Price | Title Company |
|---|---|---|---|
| Keller Linda M | -- | Chicago Title Of Michigan | |
| Keller Linda M | -- | Chicago Title Of Michigan | |
| Keller Linda M | -- | Chicago Title Of Michigan | |
| -- | $100 | -- | |
| -- | $36,900 | -- | |
| -- | $31,000 | -- |
Source: Public Records
Mortgage History
| Date | Status | Borrower | Loan Amount |
|---|---|---|---|
| Open | Keller Linda M | $112,800 | |
| Closed | Keller Linda M | $112,800 |
Source: Public Records
Tax History
| Year | Tax Paid | Tax Assessment Tax Assessment Total Assessment is a certain percentage of the fair market value that is determined by local assessors to be the total taxable value of land and additions on the property. | Land | Improvement |
|---|---|---|---|---|
| 2025 | $1,465 | $73,400 | $0 | $0 |
| 2024 | $1,150 | $65,900 | $0 | $0 |
| 2023 | $1,103 | $59,900 | $0 | $0 |
| 2022 | $1,050 | $47,100 | $0 | $0 |
| 2021 | $1,289 | $44,000 | $2,400 | $41,600 |
| 2020 | $1,275 | $42,300 | $0 | $0 |
| 2019 | $1,259 | $39,200 | $1,600 | $37,600 |
| 2018 | $1,217 | $39,200 | $0 | $0 |
| 2017 | $1,197 | $47,300 | $0 | $0 |
| 2016 | $1,172 | $44,300 | $0 | $0 |
| 2015 | $1,168 | $42,700 | $0 | $0 |
| 2014 | $912 | $40,100 | $0 | $0 |
Source: Public Records
Map
Nearby Homes
Your Personal Tour Guide
Ask me questions while you tour the home.