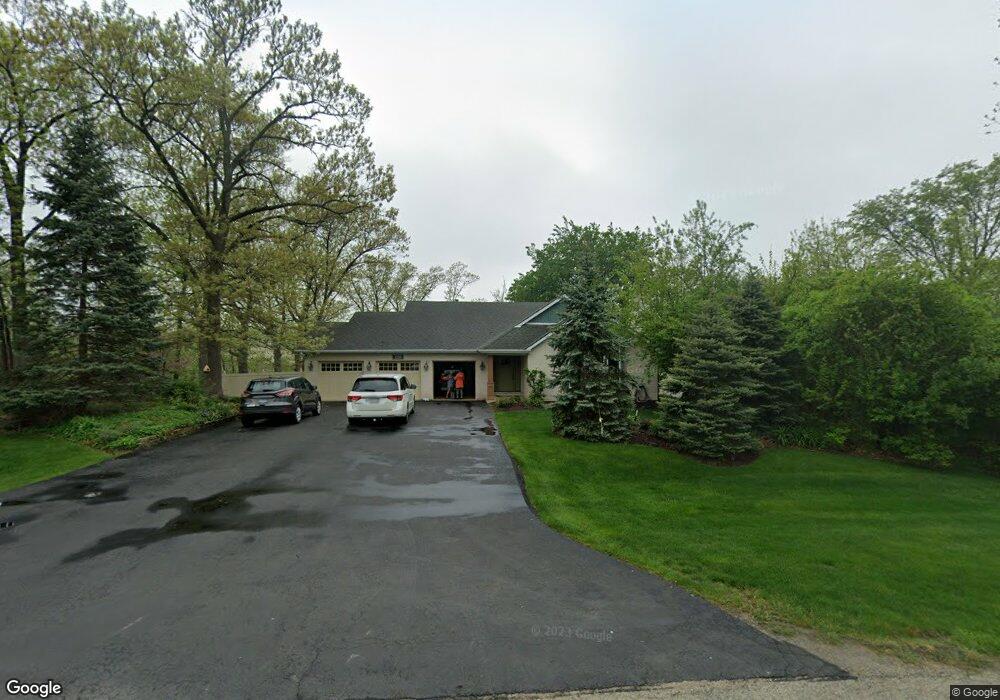
1350 Gordon Ln Lemont, IL 60439
West Lemont NeighborhoodEstimated Value: $578,750 - $687,000
4
Beds
3
Baths
1,920
Sq Ft
$326/Sq Ft
Est. Value
About This Home
This home is located at 1350 Gordon Ln, Lemont, IL 60439 and is currently estimated at $625,688, approximately $325 per square foot. 1350 Gordon Ln is a home located in Cook County with nearby schools including Oakwood School, River Valley School, and Old Quarry Middle School.
Ownership History
Date
Name
Owned For
Owner Type
Purchase Details
Closed on
Feb 28, 2025
Sold by
Thornton Elyse
Bought by
Elyse Thornton Revocable Trust and Thornton
Current Estimated Value
Purchase Details
Closed on
Jun 30, 2009
Sold by
Thornton Charles and Thornton Elyse
Bought by
Thornton Elyse
Purchase Details
Closed on
Jan 24, 2000
Sold by
Rosner Michael and Rosner Adrianne
Bought by
Thornton Charles H and Thornton Elyse
Home Financials for this Owner
Home Financials are based on the most recent Mortgage that was taken out on this home.
Original Mortgage
$125,000
Interest Rate
8.31%
Purchase Details
Closed on
Oct 23, 1998
Sold by
Anderson John E
Bought by
Rosner Michael and Rosner Adrianne
Purchase Details
Closed on
Mar 28, 1996
Sold by
Schuringa Donald R and Schuringa Theresa A
Bought by
Anderson John E
Create a Home Valuation Report for This Property
The Home Valuation Report is an in-depth analysis detailing your home's value as well as a comparison with similar homes in the area
Home Values in the Area
Average Home Value in this Area
Purchase History
| Date | Buyer | Sale Price | Title Company |
|---|---|---|---|
| Elyse Thornton Revocable Trust | -- | None Listed On Document | |
| Thornton Elyse | -- | None Available | |
| Thornton Charles H | $300,000 | Professional National Title | |
| Rosner Michael | $69,000 | Professional National Title | |
| Anderson John E | $62,000 | Attorneys Natl Title Network |
Source: Public Records
Mortgage History
| Date | Status | Borrower | Loan Amount |
|---|---|---|---|
| Previous Owner | Thornton Charles H | $125,000 | |
| Closed | Anderson John E | -- |
Source: Public Records
Tax History Compared to Growth
Tax History
| Year | Tax Paid | Tax Assessment Tax Assessment Total Assessment is a certain percentage of the fair market value that is determined by local assessors to be the total taxable value of land and additions on the property. | Land | Improvement |
|---|---|---|---|---|
| 2024 | $7,778 | $46,092 | $26,105 | $19,987 |
| 2023 | $6,692 | $46,092 | $26,105 | $19,987 |
| 2022 | $6,692 | $35,865 | $10,041 | $25,824 |
| 2021 | $6,537 | $35,864 | $10,040 | $25,824 |
| 2020 | $7,322 | $38,571 | $10,040 | $28,531 |
| 2019 | $6,883 | $38,091 | $10,040 | $28,051 |
| 2018 | $6,774 | $38,091 | $10,040 | $28,051 |
| 2017 | $7,700 | $42,834 | $10,040 | $32,794 |
| 2016 | $6,432 | $31,744 | $8,032 | $23,712 |
| 2015 | $6,710 | $32,608 | $8,032 | $24,576 |
| 2014 | $6,801 | $32,608 | $8,032 | $24,576 |
| 2013 | $8,711 | $43,567 | $8,032 | $35,535 |
Source: Public Records
Map
Nearby Homes
- 1365 Gordon Ln
- 1383 Gordon Ln
- 15822 132nd St
- 13027 Blue Grass Dr
- 12891 Mayfair Dr
- 3.1 Acres Archer Ave
- 1.7 Acres Archer Ave
- 173 Harper Ln
- 1365 State St
- 16451 Kayla Dr
- 5 Melissa Dr
- 1201 Leinster Dr
- 16701 135th St
- Ravello Plan at Villas at Rolling Meadows
- Verona Plan at Villas at Rolling Meadows
- Capri Plan at Villas at Rolling Meadows
- Sorrento Plan at Villas at Rolling Meadows
- 16520 Kayla Dr
- 16530 Kayla Dr
- 16540 Kayla Dr