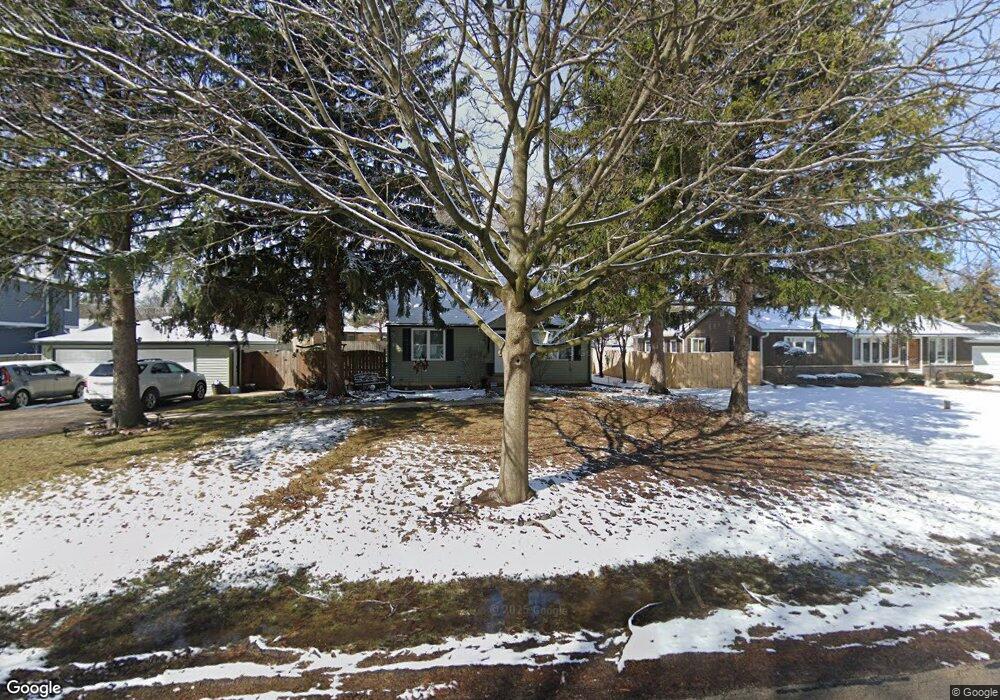
1350 S Oakland Ave Villa Park, IL 60181
Estimated Value: $317,072 - $394,000
3
Beds
--
Bath
1,200
Sq Ft
$301/Sq Ft
Est. Value
About This Home
This home is located at 1350 S Oakland Ave, Villa Park, IL 60181 and is currently estimated at $361,518, approximately $301 per square foot. 1350 S Oakland Ave is a home located in DuPage County with nearby schools including Salt Creek Elementary School, John E Albright Middle School, and Stella May Swartz Elementary School.
Ownership History
Date
Name
Owned For
Owner Type
Purchase Details
Closed on
Feb 26, 2003
Sold by
Prudential Relocation Inc
Bought by
Goodwick Michael and Principato Amy
Current Estimated Value
Purchase Details
Closed on
Feb 3, 2003
Sold by
Kappel David L and Kappel Mary M
Bought by
Prudential Relocation Inc and Citicapital Relocation Inc
Purchase Details
Closed on
Jul 25, 2001
Sold by
Howe James J and Howe Kathy L
Bought by
Kappel David L and Kappel Mary M
Home Financials for this Owner
Home Financials are based on the most recent Mortgage that was taken out on this home.
Original Mortgage
$164,000
Interest Rate
6.99%
Purchase Details
Closed on
Nov 1, 1995
Sold by
Lasalle National Trust Na
Bought by
Howe James J and Howe Kathy L
Home Financials for this Owner
Home Financials are based on the most recent Mortgage that was taken out on this home.
Original Mortgage
$139,300
Interest Rate
7.7%
Mortgage Type
FHA
Create a Home Valuation Report for This Property
The Home Valuation Report is an in-depth analysis detailing your home's value as well as a comparison with similar homes in the area
Home Values in the Area
Average Home Value in this Area
Purchase History
| Date | Buyer | Sale Price | Title Company |
|---|---|---|---|
| Goodwick Michael | $235,000 | Ticor | |
| Prudential Relocation Inc | $235,000 | Ticor | |
| Kappel David L | $208,500 | -- | |
| Howe James J | $143,000 | -- |
Source: Public Records
Mortgage History
| Date | Status | Borrower | Loan Amount |
|---|---|---|---|
| Previous Owner | Kappel David L | $164,000 | |
| Previous Owner | Howe James J | $139,300 |
Source: Public Records
Tax History Compared to Growth
Tax History
| Year | Tax Paid | Tax Assessment Tax Assessment Total Assessment is a certain percentage of the fair market value that is determined by local assessors to be the total taxable value of land and additions on the property. | Land | Improvement |
|---|---|---|---|---|
| 2024 | $4,770 | $89,605 | $49,128 | $40,477 |
| 2023 | $4,256 | $82,860 | $45,430 | $37,430 |
| 2022 | $4,151 | $79,650 | $43,670 | $35,980 |
| 2021 | $4,132 | $77,660 | $42,580 | $35,080 |
| 2020 | $4,043 | $75,960 | $41,650 | $34,310 |
| 2019 | $3,830 | $72,220 | $39,600 | $32,620 |
| 2018 | $3,768 | $67,690 | $37,120 | $30,570 |
| 2017 | $3,681 | $64,500 | $35,370 | $29,130 |
| 2016 | $3,389 | $60,760 | $33,320 | $27,440 |
| 2015 | $3,331 | $56,600 | $31,040 | $25,560 |
| 2014 | $3,624 | $60,430 | $36,790 | $23,640 |
| 2013 | $3,398 | $61,280 | $37,310 | $23,970 |
Source: Public Records
Map
Nearby Homes
- 625 E Van Buren St
- 0S639 Summit Ave
- 1046 E Van Buren St
- 650 E Van Buren St
- 2 Ardmore Ave
- 818 S Villa Ave
- 1500 S Ardmore Ave Unit 408
- 727 S Oakland Ave
- 1S325 Buttercup Ln
- 639 S Oakland Ave
- 1S134 Holyoke Ln Unit G
- 633 S Monterey Ave
- 4 Waldorf Ct
- 1S122 Stratford Ln Unit 3
- 1S150 Spring Rd Unit 5B
- 1S150 Spring Rd Unit 4L
- 18W118 14th St Unit 4
- 1S265 Dillon Ln
- 1S266 Dillon Ln
- 769 S Fairview Ave
- 1340 S Oakland Ave
- 410 E Riordan Rd
- 1330 S Oakland Ave
- 1345 S Villa Ave
- 1355 S Villa Ave
- 1355 S Oakland Ave
- 400 E Riordan Rd
- 1345 S Oakland Ave
- 440 E Riordan Rd
- 1335 S Oakland Ave
- 1335 S Villa Ave
- 1320 S Oakland Ave
- 415 E Riordan Rd
- 1325 S Oakland Ave
- 405 E Riordan Rd
- 1325 S Villa Ave
- 1340 S Monterey Ave
- 1350 S Monterey Ave
- 1310 S Oakland Ave
- 435 E Riordan Rd