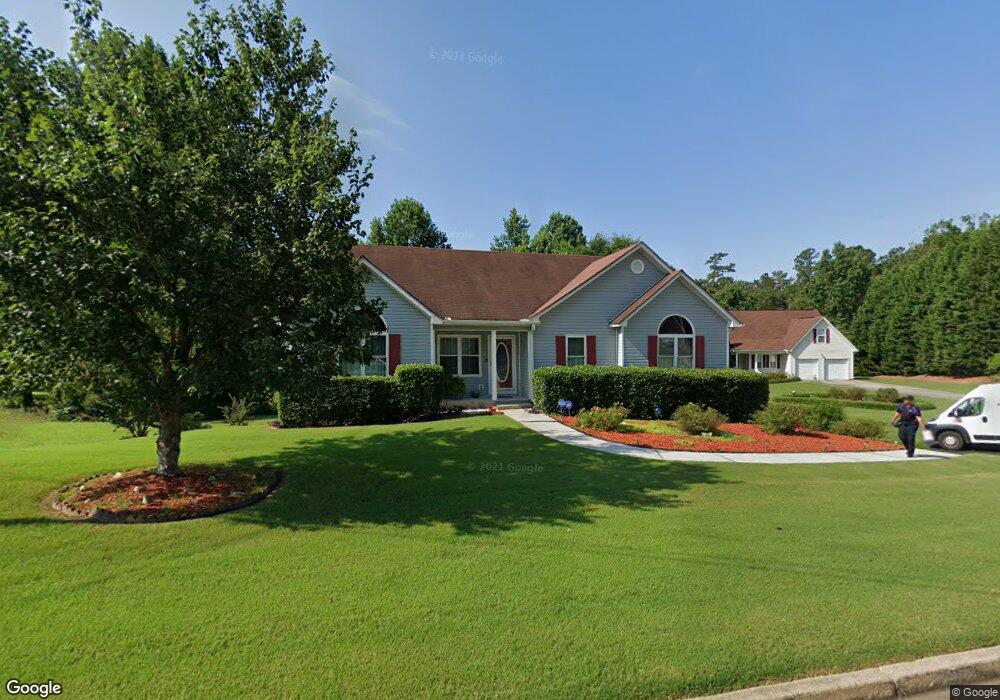
1350 Stoneleigh Dr Conyers, GA 30094
Estimated Value: $232,000 - $281,000
3
Beds
2
Baths
1,606
Sq Ft
$162/Sq Ft
Est. Value
About This Home
This home is located at 1350 Stoneleigh Dr, Conyers, GA 30094 and is currently estimated at $260,547, approximately $162 per square foot. 1350 Stoneleigh Dr is a home located in Rockdale County with nearby schools including Shoal Creek Elementary School, Gen. Ray Davis Middle School, and Rockdale County High School.
Ownership History
Date
Name
Owned For
Owner Type
Purchase Details
Closed on
Mar 31, 2008
Sold by
Hud-Housing Of Urban Dev
Bought by
Ramos Carlos M and Ramos Felia M
Current Estimated Value
Home Financials for this Owner
Home Financials are based on the most recent Mortgage that was taken out on this home.
Original Mortgage
$126,428
Outstanding Balance
$79,010
Interest Rate
5.97%
Mortgage Type
FHA
Estimated Equity
$181,537
Purchase Details
Closed on
May 1, 2007
Sold by
Wells Fargo Bank Na
Bought by
Hud-Housing Of Urban Dev
Purchase Details
Closed on
Jul 29, 1998
Sold by
Howard G Pennington Inc
Bought by
Barner Chaunces A and Barner Mary, C
Home Financials for this Owner
Home Financials are based on the most recent Mortgage that was taken out on this home.
Original Mortgage
$114,000
Interest Rate
6.96%
Mortgage Type
New Conventional
Create a Home Valuation Report for This Property
The Home Valuation Report is an in-depth analysis detailing your home's value as well as a comparison with similar homes in the area
Home Values in the Area
Average Home Value in this Area
Purchase History
| Date | Buyer | Sale Price | Title Company |
|---|---|---|---|
| Ramos Carlos M | -- | -- | |
| Hud-Housing Of Urban Dev | $164,408 | -- | |
| Wells Fargo Bank Na | $164,408 | -- | |
| Barner Chaunces A | $120,000 | -- |
Source: Public Records
Mortgage History
| Date | Status | Borrower | Loan Amount |
|---|---|---|---|
| Open | Ramos Carlos M | $126,428 | |
| Previous Owner | Barner Chaunces A | $114,000 |
Source: Public Records
Tax History
| Year | Tax Paid | Tax Assessment Tax Assessment Total Assessment is a certain percentage of the fair market value that is determined by local assessors to be the total taxable value of land and additions on the property. | Land | Improvement |
|---|---|---|---|---|
| 2025 | $2,254 | $88,760 | $20,800 | $67,960 |
| 2024 | $2,074 | $88,760 | $20,800 | $67,960 |
| 2023 | $1,760 | $79,120 | $15,480 | $63,640 |
| 2022 | $1,659 | $75,200 | $15,480 | $59,720 |
| 2021 | $1,326 | $59,160 | $9,440 | $49,720 |
| 2020 | $919 | $45,640 | $6,920 | $38,720 |
| 2019 | $942 | $45,640 | $6,920 | $38,720 |
| 2018 | $608 | $34,640 | $5,600 | $29,040 |
| 2017 | $548 | $32,480 | $5,600 | $26,880 |
| 2016 | $506 | $32,480 | $5,600 | $26,880 |
| 2015 | $432 | $29,880 | $6,000 | $23,880 |
| 2014 | $260 | $24,840 | $3,920 | $20,920 |
| 2013 | -- | $31,640 | $4,040 | $27,600 |
Source: Public Records
Map
Nearby Homes
- 2494 Turner Rd SW
- 747 Briarwood Rd SW
- 2275 Briarwood Dr SW
- 3492 Heathervale Way SW
- 2296 Briarwood Cir SW
- 925 McDaniel Mill Rd SW
- 2204 Brandon Ln SW Unit 2
- 734 Havenridge Dr SW
- 395 Cedar Ln SW
- 814 Cambridge Creek Dr SW
- 749 Havenridge Dr SW
- 423 Center Cir SW
- 1092 W Adrian Cir SW
- 318 Cedar Hollow Dr
- 318 Cedar Ln SW Unit 157
- 2104 Moon Dr SW
- 464 Abbott Rd SW
- 1103 W Adrian Cir SW
- 2091 Moon Dr SW
- 2881 Glenhaven Ct SW
- 1360 Stoneleigh Dr Unit 5
- 1340 Stoneleigh Dr
- 1370 Stoneleigh Dr
- 1351 Stoneleigh Dr Unit 5
- 1341 Stoneleigh Dr
- 1361 Stoneleigh Dr
- 1371 Stoneleigh Dr Unit 5
- 1330 Stoneleigh Dr
- 1331 Stoneleigh Dr
- 1320 Stoneleigh Dr
- 2488 Turner Rd SW
- 2490 Turner Rd SW Unit 2
- 1310 Stoneleigh Dr
- 2494 Turner Rd SW Unit 2/01
- 2458 Turner Rd SW
- 763 McDaniel Mill Rd SW
- 1311 Stoneleigh Dr Unit 5
- 2448 Turner Rd SW Unit 4
- 1300 Stoneleigh Dr
- 755 McDaniel Mill Rd SW
Your Personal Tour Guide
Ask me questions while you tour the home.