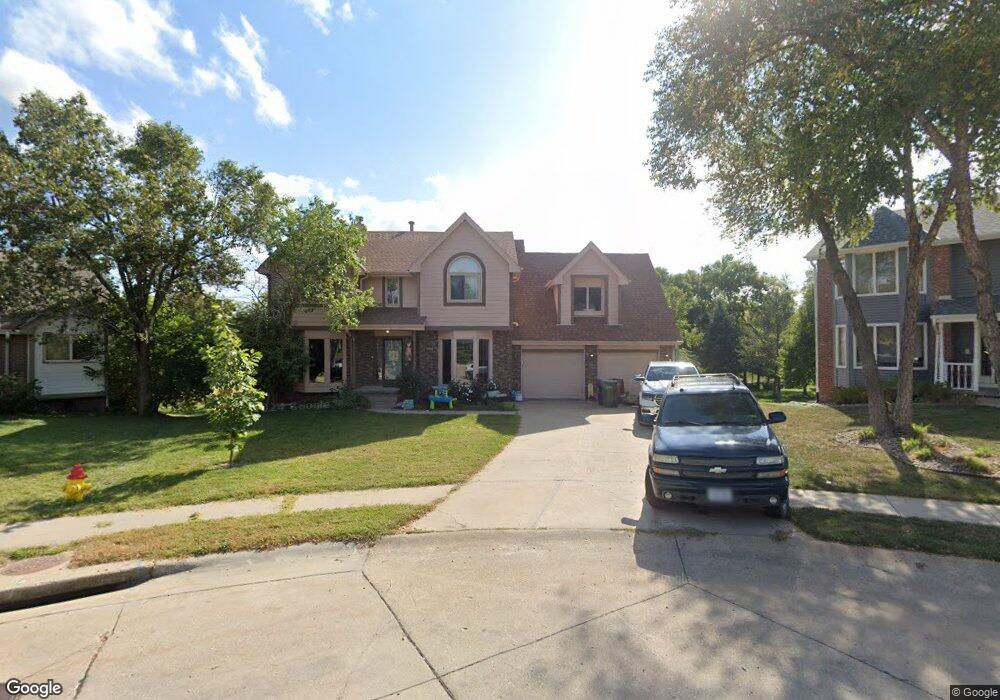
13506 S 26th Cir Bellevue, NE 68123
Estimated Value: $362,324 - $403,000
4
Beds
5
Baths
2,496
Sq Ft
$152/Sq Ft
Est. Value
About This Home
This home is located at 13506 S 26th Cir, Bellevue, NE 68123 and is currently estimated at $379,831, approximately $152 per square foot. 13506 S 26th Cir is a home located in Sarpy County with nearby schools including Leonard Lawrence Elementary School, Lewis & Clark Middle School, and Bellevue West High School.
Ownership History
Date
Name
Owned For
Owner Type
Purchase Details
Closed on
Aug 17, 2020
Sold by
Gantos Gabriel Delos and Delos Santos Jeanne
Bought by
Ott Jacob H and Ott Brianne J
Current Estimated Value
Home Financials for this Owner
Home Financials are based on the most recent Mortgage that was taken out on this home.
Original Mortgage
$240,000
Outstanding Balance
$212,500
Interest Rate
2.9%
Mortgage Type
New Conventional
Estimated Equity
$167,331
Purchase Details
Closed on
Nov 27, 2002
Sold by
Miller Paula L
Bought by
Delossantos Gabriel and Delossantos Jeanne M
Home Financials for this Owner
Home Financials are based on the most recent Mortgage that was taken out on this home.
Original Mortgage
$197,850
Interest Rate
6.28%
Purchase Details
Closed on
Feb 23, 1999
Sold by
Miller Daniel V
Bought by
Miller Paula L
Create a Home Valuation Report for This Property
The Home Valuation Report is an in-depth analysis detailing your home's value as well as a comparison with similar homes in the area
Home Values in the Area
Average Home Value in this Area
Purchase History
| Date | Buyer | Sale Price | Title Company |
|---|---|---|---|
| Ott Jacob H | $275,000 | Rts Title & Escrow | |
| Delossantos Gabriel | $194,000 | -- | |
| Miller Paula L | -- | -- |
Source: Public Records
Mortgage History
| Date | Status | Borrower | Loan Amount |
|---|---|---|---|
| Open | Ott Jacob H | $240,000 | |
| Previous Owner | Delossantos Gabriel | $197,850 |
Source: Public Records
Tax History Compared to Growth
Tax History
| Year | Tax Paid | Tax Assessment Tax Assessment Total Assessment is a certain percentage of the fair market value that is determined by local assessors to be the total taxable value of land and additions on the property. | Land | Improvement |
|---|---|---|---|---|
| 2025 | $5,813 | $355,374 | $58,000 | $297,374 |
| 2024 | $6,654 | $334,556 | $53,000 | $281,556 |
| 2023 | $6,654 | $315,100 | $47,000 | $268,100 |
| 2022 | $6,035 | $280,422 | $47,000 | $233,422 |
| 2021 | $5,785 | $265,953 | $47,000 | $218,953 |
| 2020 | $5,098 | $233,632 | $41,000 | $192,632 |
| 2019 | $5,024 | $231,692 | $41,000 | $190,692 |
| 2018 | $5,330 | $229,973 | $39,000 | $190,973 |
| 2017 | $5,118 | $218,151 | $39,000 | $179,151 |
| 2016 | $5,391 | $234,244 | $35,000 | $199,244 |
| 2015 | $5,202 | $230,508 | $33,000 | $197,508 |
| 2014 | $5,070 | $225,415 | $33,000 | $192,415 |
| 2012 | -- | $211,878 | $33,000 | $178,878 |
Source: Public Records
Map
Nearby Homes
- 2512 Nottingham Dr
- 13403 S 28th St
- 13211 S 26th Ave
- 2923 Blackhawk Dr
- 2939 Lone Tree Rd
- 2810 Bar Harbor Dr
- 14002 Tregaron Ridge Ave Unit B
- 12901 S 29th Place
- 3105 Mirror Cir
- 12722 S 28th Ave
- 14112 S 22nd St
- 3309 Lookingglass Dr
- 2940 Leawood Dr
- 3113 Tammy St
- 3102 Redwing Dr
- 3105 Leawood Dr
- 13908 S 17th St
- 14107 S 18th St
- 1506 Halifax St
- 14415 S 29th St
- 13506 S 26th Cir
- 13504 S 26th Cr St
- 13504 S 26th Cir
- 13507 S 26th Cir
- 2603 Blackhawk Dr
- 13505 S 26th Cir
- 2605 Blackhawk Dr
- 2511 Blackhawk Dr
- 2607 Blackhawk Dr
- 2702 Rahn Blvd
- 2509 Blackhawk Dr
- 2606 Blackhawk Blvd
- 2608 Rahn Blvd
- 2609 Blackhawk Dr
- 2706 Rahn Blvd
- 2606 Rahn Blvd
- 2507 Blackhawk Dr
- 2708 Rahn Blvd
- 2604 Blackhawk Dr
- 2611 Blackhawk Dr