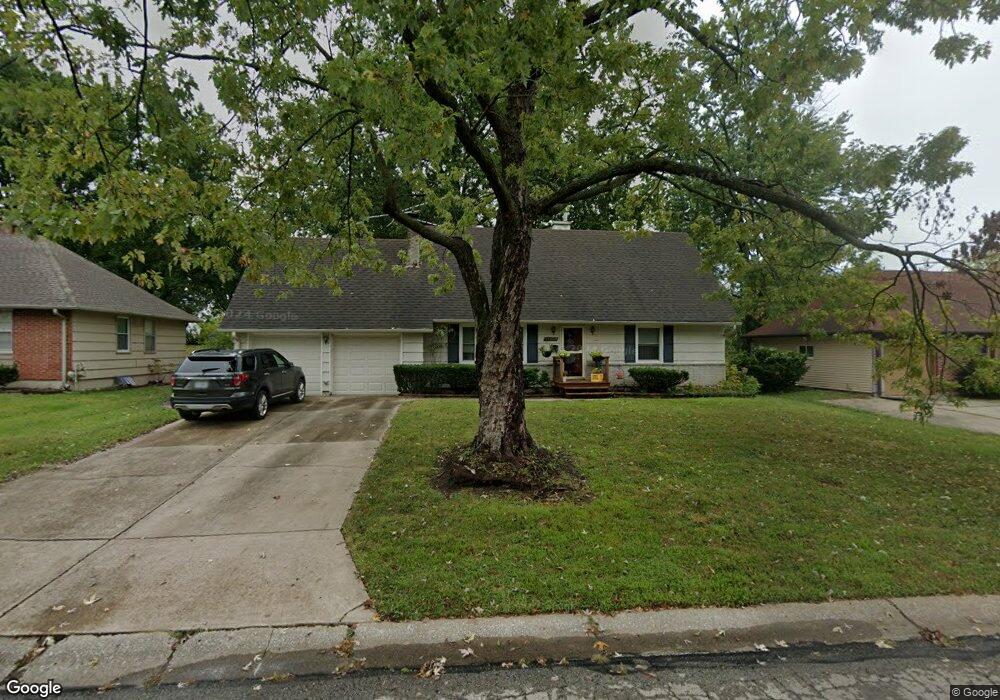
13509 Spring St Grandview, MO 64030
Estimated Value: $226,743 - $276,000
4
Beds
2
Baths
1,560
Sq Ft
$160/Sq Ft
Est. Value
About This Home
This home is located at 13509 Spring St, Grandview, MO 64030 and is currently estimated at $249,436, approximately $159 per square foot. 13509 Spring St is a home located in Jackson County with nearby schools including Butcher-Greene Elementary School, Grandview Middle, and Grandview High School.
Ownership History
Date
Name
Owned For
Owner Type
Purchase Details
Closed on
Jul 20, 2005
Sold by
Accessible Electric Inc
Bought by
Mcconnell Reginald and Mcconnell Deborah
Current Estimated Value
Purchase Details
Closed on
Dec 23, 2004
Sold by
S & W Development Llc
Bought by
Vaughn Billy Lee and Vaughn Tammy J
Home Financials for this Owner
Home Financials are based on the most recent Mortgage that was taken out on this home.
Original Mortgage
$127,760
Interest Rate
5.76%
Mortgage Type
Construction
Purchase Details
Closed on
Sep 18, 2001
Sold by
Jeffries John G and Jeffries Janice J
Bought by
Fuller Carola J
Home Financials for this Owner
Home Financials are based on the most recent Mortgage that was taken out on this home.
Original Mortgage
$100,000
Interest Rate
6.96%
Mortgage Type
Purchase Money Mortgage
Create a Home Valuation Report for This Property
The Home Valuation Report is an in-depth analysis detailing your home's value as well as a comparison with similar homes in the area
Home Values in the Area
Average Home Value in this Area
Purchase History
| Date | Buyer | Sale Price | Title Company |
|---|---|---|---|
| Mcconnell Reginald | -- | Kansas City Title | |
| Vaughn Billy Lee | -- | Security Land Title Company | |
| Fuller Carola J | -- | Chicago Title Co |
Source: Public Records
Mortgage History
| Date | Status | Borrower | Loan Amount |
|---|---|---|---|
| Previous Owner | Vaughn Billy Lee | $127,760 | |
| Previous Owner | Fuller Carola J | $100,000 |
Source: Public Records
Tax History Compared to Growth
Tax History
| Year | Tax Paid | Tax Assessment Tax Assessment Total Assessment is a certain percentage of the fair market value that is determined by local assessors to be the total taxable value of land and additions on the property. | Land | Improvement |
|---|---|---|---|---|
| 2025 | $2,410 | $30,655 | $5,157 | $25,498 |
| 2024 | $2,369 | $29,640 | $4,115 | $25,525 |
| 2023 | $2,369 | $29,640 | $4,115 | $25,525 |
| 2022 | $1,990 | $23,180 | $3,658 | $19,522 |
| 2021 | $1,988 | $23,180 | $3,658 | $19,522 |
| 2020 | $1,782 | $22,009 | $3,658 | $18,351 |
| 2019 | $1,719 | $22,009 | $3,658 | $18,351 |
| 2018 | $1,379 | $16,432 | $3,435 | $12,997 |
| 2017 | $1,379 | $16,432 | $3,435 | $12,997 |
| 2016 | $1,338 | $15,613 | $3,052 | $12,561 |
| 2014 | $1,331 | $15,307 | $2,993 | $12,314 |
Source: Public Records
Map
Nearby Homes
- 13424 Parker Ave
- 6104 E 136th St
- 13517 Lowell Ave
- 13420 Belmead Ave
- 13425 Belmead Ave
- 6604 E 135th St
- 13407 Bennington Ave
- 13620 Bennington Ave
- 13303 Bennington Ave
- 13227 Bennington Ave
- 13747 Parker Ave
- 14925 S U S 71 Hwy
- 13128 Lowell Ave
- 13516 12th St
- 13804 Bennington Ave
- 13218 Craig Ave
- 6206 E 140th Terrace
- 13408 Bristol Ave
- 13301 10th St
- 14051 Dunbar Ct
- 13513 Spring St
- 13505 Spring St
- 13508 Spring St
- 13512 Spring St
- 13504 Spring St
- 13517 Spring St
- 13501 Spring St
- 13504 Parker Ave
- 13516 Spring St
- 13512 Parker Ave
- 13500 Parker Ave
- 13521 Spring St
- 13516 Parker Ave
- 13520 Spring St
- 1812 E 135th St
- 1816 E 135th St
- 13509 Parker Ave
- 13505 Parker Ave
- 13513 Parker Ave
- 13525 Spring St