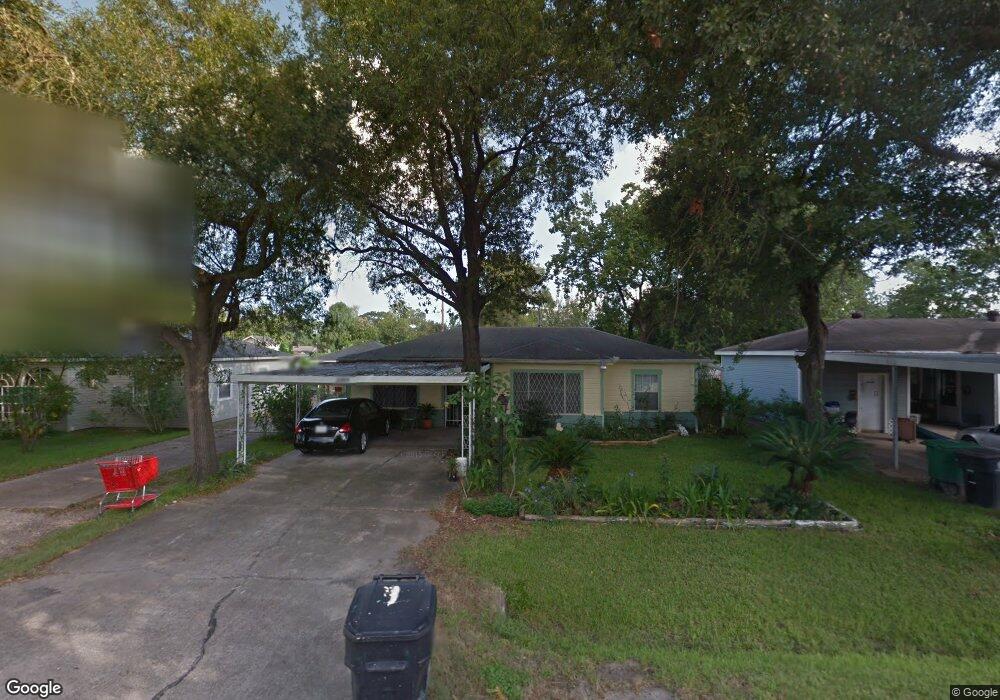
13509 Vicksburg St Houston, TX 77015
North Shore NeighborhoodEstimated Value: $152,000 - $210,000
2
Beds
1
Bath
1,182
Sq Ft
$146/Sq Ft
Est. Value
About This Home
This home is located at 13509 Vicksburg St, Houston, TX 77015 and is currently estimated at $172,336, approximately $145 per square foot. 13509 Vicksburg St is a home located in Harris County with nearby schools including Cimarron Elementary School, Cobb 6th Grade Campus, and North Shore Middle School.
Ownership History
Date
Name
Owned For
Owner Type
Purchase Details
Closed on
Apr 19, 2007
Sold by
Hill Elizabeth Mae
Bought by
Rodriguez Luis A
Current Estimated Value
Home Financials for this Owner
Home Financials are based on the most recent Mortgage that was taken out on this home.
Original Mortgage
$77,388
Outstanding Balance
$46,791
Interest Rate
6.15%
Mortgage Type
FHA
Estimated Equity
$125,545
Purchase Details
Closed on
Mar 30, 2007
Sold by
Shockley Patsy Ruth
Bought by
Hill Elizabeth Mae
Home Financials for this Owner
Home Financials are based on the most recent Mortgage that was taken out on this home.
Original Mortgage
$77,388
Outstanding Balance
$46,791
Interest Rate
6.15%
Mortgage Type
FHA
Estimated Equity
$125,545
Purchase Details
Closed on
Sep 11, 2002
Sold by
Hill Elizabeth Mae
Bought by
Shockley Patsy Ruth
Purchase Details
Closed on
Jan 25, 1999
Sold by
Shockley Patsy Ruth and Mcnatt James Wesley
Bought by
Hill Elizabeth Mae
Create a Home Valuation Report for This Property
The Home Valuation Report is an in-depth analysis detailing your home's value as well as a comparison with similar homes in the area
Home Values in the Area
Average Home Value in this Area
Purchase History
| Date | Buyer | Sale Price | Title Company |
|---|---|---|---|
| Rodriguez Luis A | -- | American Title Co | |
| Hill Elizabeth Mae | -- | American Title Co | |
| Shockley Patsy Ruth | -- | -- | |
| Hill Elizabeth Mae | -- | -- |
Source: Public Records
Mortgage History
| Date | Status | Borrower | Loan Amount |
|---|---|---|---|
| Open | Rodriguez Luis A | $77,388 |
Source: Public Records
Tax History Compared to Growth
Tax History
| Year | Tax Paid | Tax Assessment Tax Assessment Total Assessment is a certain percentage of the fair market value that is determined by local assessors to be the total taxable value of land and additions on the property. | Land | Improvement |
|---|---|---|---|---|
| 2025 | $1,203 | $150,392 | $64,800 | $85,592 |
| 2024 | $1,203 | $146,415 | $64,800 | $81,615 |
| 2023 | $1,203 | $173,840 | $56,700 | $117,140 |
| 2022 | $2,442 | $140,626 | $48,600 | $92,026 |
| 2021 | $2,385 | $118,698 | $34,830 | $83,868 |
| 2020 | $2,218 | $95,288 | $34,830 | $60,458 |
| 2019 | $2,118 | $88,980 | $31,590 | $57,390 |
| 2018 | $421 | $64,683 | $17,415 | $47,268 |
| 2017 | $1,919 | $64,683 | $17,415 | $47,268 |
| 2016 | $1,807 | $64,683 | $17,415 | $47,268 |
| 2015 | $976 | $57,806 | $17,415 | $40,391 |
| 2014 | $976 | $50,321 | $17,415 | $32,906 |
Source: Public Records
Map
Nearby Homes
- 13430 Duluth St
- 13434 Duluth St
- 13522 Boise St
- 1035 Nadolney St
- 13362 Emporia St
- 13430 Orleans St
- 13331 Emporia St
- 13505 Orleans St
- 13842 Laredo St
- 13210 Rockglen St
- 13122 Emporia St
- 13326 Joliet St
- 13379 Louisville St
- 13218 Indianapolis St
- 1402 W Victorson St
- TBD Gainesville St
- 806 Westmont Dr
- 505 Evanston St
- 910 Rosewick St
- 13350 Granada St
- 13505 Vicksburg St
- 13501 Vicksburg St
- 13517 Vicksburg St
- 13510 Bandera St
- 13514 Bandera St
- 13506 Bandera St
- 13433 Vicksburg St
- 13502 Bandera St
- 13521 Vicksburg St
- 13518 Bandera St
- 13510 Vicksburg St
- 13514 Vicksburg St
- 13506 Vicksburg St
- 13434 Bandera St
- 13522 Bandera St
- 13502 Vicksburg St
- 13518 Vicksburg St
- 13429 Vicksburg St
- 13525 Vicksburg St
- 13434 Vicksburg St