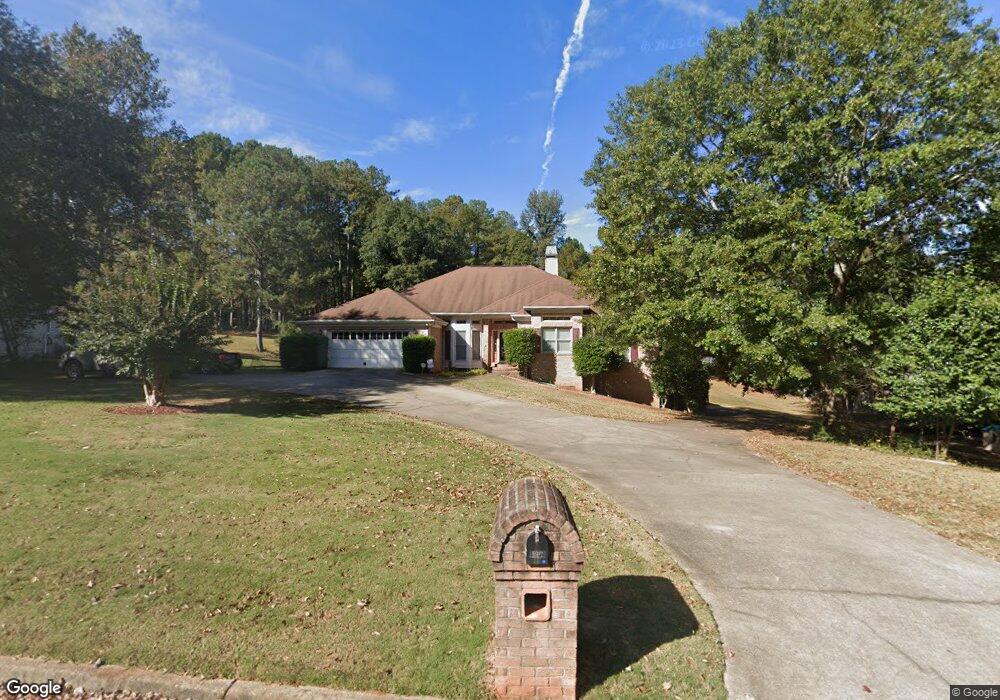
1351 N Brandy Shoals SE Unit 41 Conyers, GA 30013
Estimated Value: $352,000 - $540,000
3
Beds
4
Baths
2,666
Sq Ft
$167/Sq Ft
Est. Value
About This Home
This home is located at 1351 N Brandy Shoals SE Unit 41, Conyers, GA 30013 and is currently estimated at $444,212, approximately $166 per square foot. 1351 N Brandy Shoals SE Unit 41 is a home located in Rockdale County with nearby schools including Barksdale Elementary School, Memorial Middle School, and Salem High School.
Ownership History
Date
Name
Owned For
Owner Type
Purchase Details
Closed on
May 17, 2016
Sold by
Prof 2013 M4 Legal Title Trust
Bought by
Haynes Theron
Current Estimated Value
Home Financials for this Owner
Home Financials are based on the most recent Mortgage that was taken out on this home.
Original Mortgage
$162,993
Outstanding Balance
$131,131
Interest Rate
3.99%
Mortgage Type
FHA
Estimated Equity
$313,081
Purchase Details
Closed on
May 10, 2016
Sold by
Citimortgage Inc
Bought by
Prof 2013 M4 Legal Trtle Trust
Home Financials for this Owner
Home Financials are based on the most recent Mortgage that was taken out on this home.
Original Mortgage
$162,993
Outstanding Balance
$131,131
Interest Rate
3.99%
Mortgage Type
FHA
Estimated Equity
$313,081
Purchase Details
Closed on
Jun 2, 2015
Sold by
Wilson Dee Jay
Bought by
Citimortgage Inc
Purchase Details
Closed on
May 7, 1999
Sold by
Wilson Dee J
Bought by
Wilson Dee J and Wilson Heather M
Home Financials for this Owner
Home Financials are based on the most recent Mortgage that was taken out on this home.
Original Mortgage
$204,155
Interest Rate
6.87%
Mortgage Type
New Conventional
Create a Home Valuation Report for This Property
The Home Valuation Report is an in-depth analysis detailing your home's value as well as a comparison with similar homes in the area
Home Values in the Area
Average Home Value in this Area
Purchase History
| Date | Buyer | Sale Price | Title Company |
|---|---|---|---|
| Haynes Theron | $166,000 | -- | |
| Prof 2013 M4 Legal Trtle Trust | -- | -- | |
| Citimortgage Inc | $169,000 | -- | |
| Wilson Dee J | -- | -- | |
| Wilson Dee J | $214,900 | -- |
Source: Public Records
Mortgage History
| Date | Status | Borrower | Loan Amount |
|---|---|---|---|
| Open | Haynes Theron | $162,993 | |
| Previous Owner | Wilson Dee J | $204,155 |
Source: Public Records
Tax History Compared to Growth
Tax History
| Year | Tax Paid | Tax Assessment Tax Assessment Total Assessment is a certain percentage of the fair market value that is determined by local assessors to be the total taxable value of land and additions on the property. | Land | Improvement |
|---|---|---|---|---|
| 2024 | $4,484 | $178,760 | $36,160 | $142,600 |
| 2023 | $4,010 | $166,080 | $31,480 | $134,600 |
| 2022 | $3,152 | $132,680 | $24,960 | $107,720 |
| 2021 | $2,704 | $108,240 | $20,000 | $88,240 |
| 2020 | $2,815 | $108,240 | $20,000 | $88,240 |
| 2019 | $2,397 | $92,360 | $9,800 | $82,560 |
| 2018 | $2,266 | $87,640 | $9,800 | $77,840 |
| 2017 | $1,630 | $78,480 | $9,800 | $68,680 |
| 2016 | $3,698 | $80,880 | $9,800 | $71,080 |
| 2015 | $1,719 | $73,640 | $9,800 | $63,840 |
| 2014 | $1,594 | $75,880 | $10,920 | $64,960 |
| 2013 | -- | $78,840 | $14,400 | $64,440 |
Source: Public Records
Map
Nearby Homes
- 1311 N Brandy Shoals SE
- 1540 Christian Cir SE
- 1580 Christian Cir SE
- 217 Limestone Cir
- Grandview Plan at Underwood Crossing
- Stanley Plan at Underwood Crossing
- Waverly Plan at Underwood Crossing
- Eliott Plan at Underwood Crossing
- 247 Lotus Ln
- 1828 Brandy Woods Dr SE
- 1790 Brandy Woods Trail SE
- 254 Lotus Ln Unit 78
- 193 Lotus Ln Unit 28
- 193 Lotus Ln
- 188 Lotus Ln
- 188 Lotus Ln Unit 83
- 65 Allspice Dr
- 273 Lotus Ln Unit 20
- 229 Lotus Ln
- 234 Lotus Ln Unit 79
- 1351 N Brandy Shoals SE
- N Brandy Shoals Dr NE
- N Brandy Shoals Dr NE Unit 41
- 1341 N Brandy Shoals SE
- 1361 N Brandy Shoals SE
- 1380 E Brandy Shoals SE
- N N Brandy Shoals SE
- 1330 N Brandy Shoals SE
- 1331 N Brandy Shoals SE
- 1340 N Brandy Shoals SE
- E E Brandy Shoals SE
- 1371 E Brandy Shoals SE
- 1320 N Brandy Shoals SE
- 0 Brandy Shoals Ct SE
- 1370 E Brandy Shoals SE
- 1361 E Brandy Shoals SE
- 1421 Brandy Shoals Ct SE
- 1381 E Brandy Shoals SE
- 1321 N Brandy Shoals SE
- 1391 E Brandy Shoals SE