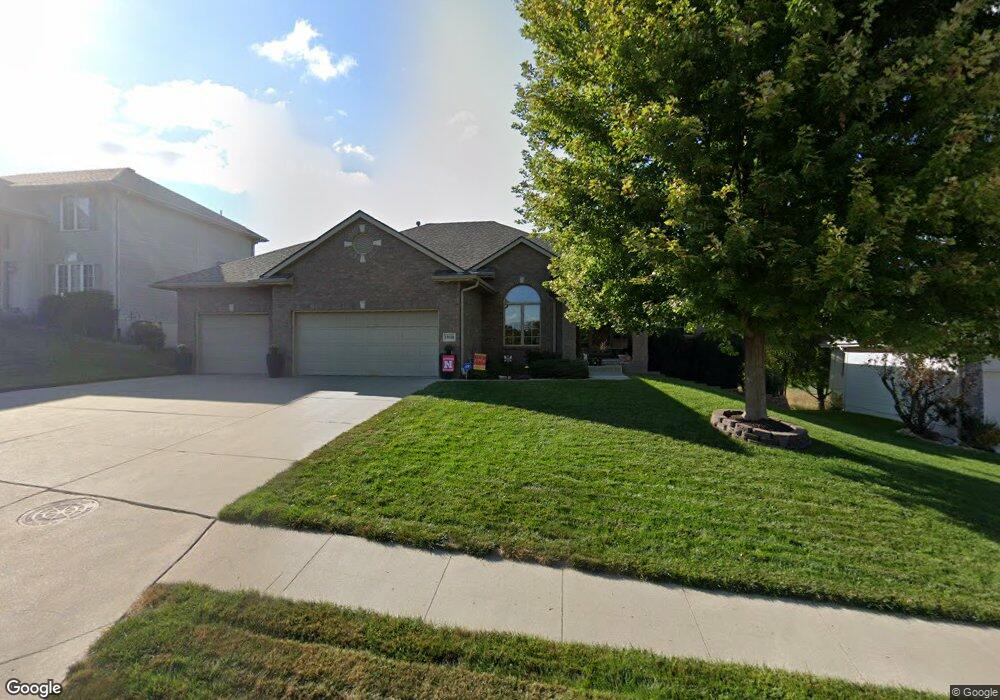
13510 Tregaron Cir Bellevue, NE 68123
Estimated Value: $461,000 - $556,502
2
Beds
3
Baths
2,042
Sq Ft
$257/Sq Ft
Est. Value
About This Home
This home is located at 13510 Tregaron Cir, Bellevue, NE 68123 and is currently estimated at $525,626, approximately $257 per square foot. 13510 Tregaron Cir is a home located in Sarpy County with nearby schools including Fairview Elementary School, Bellevue Mission Middle School, and Bellevue West High School.
Ownership History
Date
Name
Owned For
Owner Type
Purchase Details
Closed on
Aug 14, 2006
Sold by
Trapp Mark K and Trapp Renee M
Bought by
Marquardt Hodges Jay D and Marquardt Hodges Gail
Current Estimated Value
Home Financials for this Owner
Home Financials are based on the most recent Mortgage that was taken out on this home.
Original Mortgage
$293,200
Outstanding Balance
$176,319
Interest Rate
6.79%
Estimated Equity
$349,307
Purchase Details
Closed on
Apr 25, 2002
Sold by
Daniels Homes Inc
Bought by
Trapp Mark K and Trapp Renee M
Home Financials for this Owner
Home Financials are based on the most recent Mortgage that was taken out on this home.
Original Mortgage
$225,000
Interest Rate
7.11%
Purchase Details
Closed on
Dec 21, 2001
Sold by
Boyer Young Development
Bought by
Daniels Homes Inc
Home Financials for this Owner
Home Financials are based on the most recent Mortgage that was taken out on this home.
Original Mortgage
$229,100
Interest Rate
6.41%
Mortgage Type
Small Business Administration
Create a Home Valuation Report for This Property
The Home Valuation Report is an in-depth analysis detailing your home's value as well as a comparison with similar homes in the area
Home Values in the Area
Average Home Value in this Area
Purchase History
| Date | Buyer | Sale Price | Title Company |
|---|---|---|---|
| Marquardt Hodges Jay D | $367,000 | Dakota Title & Escrow Co | |
| Trapp Mark K | $287,000 | -- | |
| Daniels Homes Inc | $42,000 | -- |
Source: Public Records
Mortgage History
| Date | Status | Borrower | Loan Amount |
|---|---|---|---|
| Open | Marquardt Hodges Jay D | $293,200 | |
| Closed | Trapp Mark K | $225,000 | |
| Closed | Daniels Homes Inc | $229,100 |
Source: Public Records
Tax History Compared to Growth
Tax History
| Year | Tax Paid | Tax Assessment Tax Assessment Total Assessment is a certain percentage of the fair market value that is determined by local assessors to be the total taxable value of land and additions on the property. | Land | Improvement |
|---|---|---|---|---|
| 2025 | $9,016 | $543,257 | $72,000 | $471,257 |
| 2024 | $9,674 | $514,450 | $72,000 | $442,450 |
| 2023 | $9,674 | $458,135 | $67,000 | $391,135 |
| 2022 | $9,117 | $423,661 | $62,000 | $361,661 |
| 2021 | $8,560 | $393,512 | $62,000 | $331,512 |
| 2020 | $8,375 | $383,822 | $62,000 | $321,822 |
| 2019 | $8,306 | $369,966 | $52,000 | $317,966 |
| 2018 | $7,889 | $360,618 | $52,000 | $308,618 |
| 2017 | $7,902 | $358,203 | $52,000 | $306,203 |
| 2016 | $7,559 | $349,741 | $52,000 | $297,741 |
| 2015 | $7,273 | $343,631 | $52,000 | $291,631 |
| 2014 | $7,126 | $328,343 | $47,000 | $281,343 |
| 2012 | -- | $331,614 | $47,000 | $284,614 |
Source: Public Records
Map
Nearby Homes
- 0000 Cedar Island Road East of Old 36th St
- 13801 S 22nd Cir
- 1506 Halifax St
- 13908 S 17th St
- 14107 S 18th St
- 14112 S 22nd St
- 2512 Nottingham Dr
- 14002 Tregaron Ridge Ave Unit B
- 14319 Tregaron Dr
- 1909 Plymouth Rock Rd
- 13403 S 28th St
- 14502 S 22nd St
- 1709 Mayflower Rd
- 2923 Blackhawk Dr
- 12901 S 29th Place
- 12722 S 28th Ave
- 13902 Rahn Blvd
- 14806 S 19th St
- 2506 Hummingbird Cir
- 14415 S 29th St
- 13508 Tregaron Cir
- 13512 Tregaron Dr
- 14002 Tregaron Cir
- 13514 Tregaron Dr
- 13506 Tregaron Cir
- 1704 Spencer St
- 13405 Tregaron Dr
- 13517 Tregaron Dr
- 13516 Tregaron Dr
- 13504 Tregaron Cir
- 13601 Tregaron Dr
- 13511 Tregaron Cir
- 1702 Spencer St
- 1702 Spencer
- 13603 Tregaron Dr
- 13509 Tregaron Cr
- 13509 Tregaron Cir
- 13602 S 18th St
- 13502 Tregaron Cir
- 13602 Tregaron Dr